The Journey Has Just Begun
October 11, 2019In Fall 2018, the Batting Birds community sprinted through the first round of data collection. The researchers then set to work on turning the data into visualizations for us to explore. We worked with programmers and tested several versions of the tool that many of you used in the last month. Together, we explored what the first round of data revealed about the birds and their social lives at the feeder.
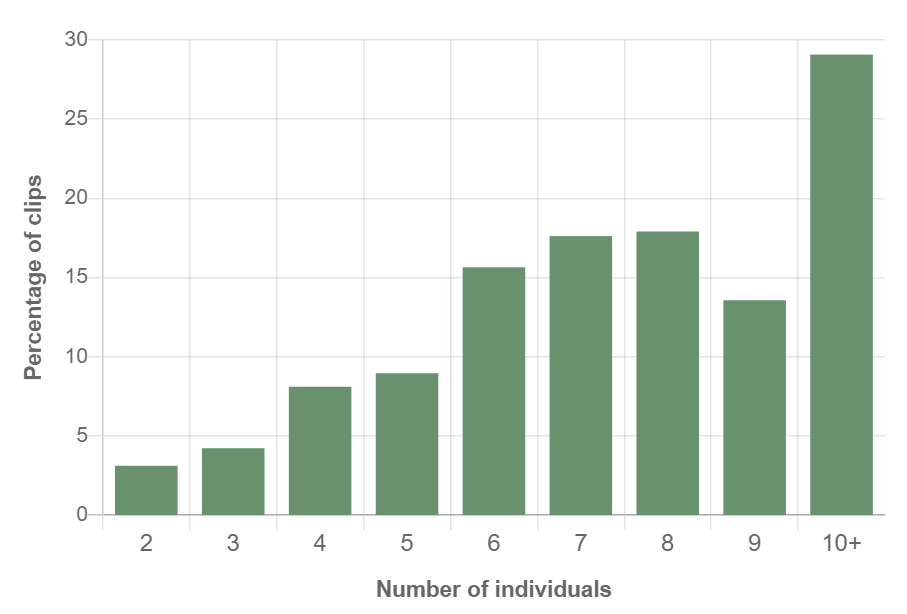
As you may recall, we set out to answer the question, “How does the number of species and individuals affect behavioral interactions (specifically displacements) at a feeder?” Displacements are attempts by one bird to take the food or perch of another bird and can be successful or unsuccessful.
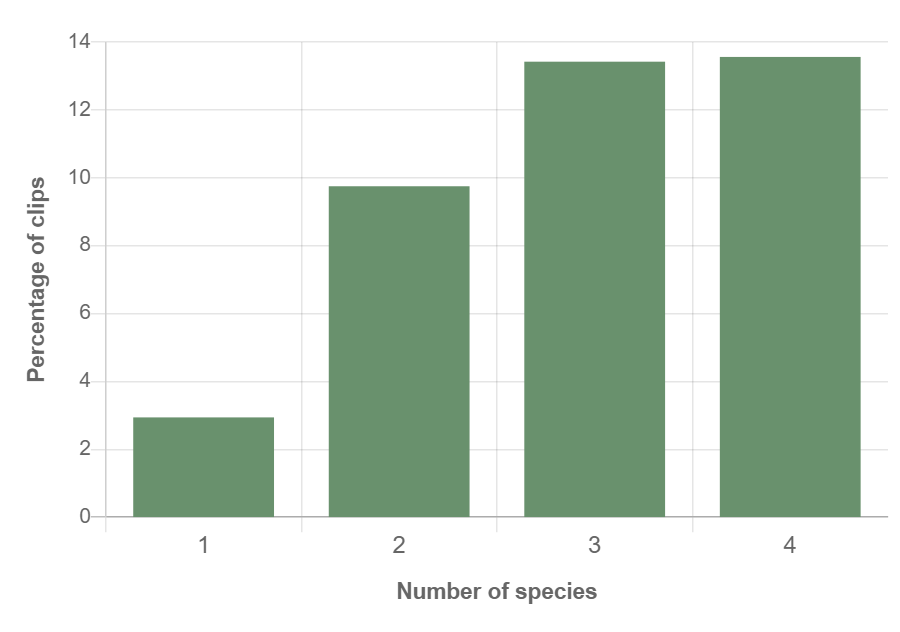
In our first exploration of the data, we found a potentially exciting pattern! As the number of individuals and species increased, the percentage of clips with a displacement also increased.
 We didn’t stop there, though! Behind these potential patterns lay important information to consider. We explored more specifically which species were battling it out on the feeder, and found that species initiated more displacements against their own species than other species. We also found that species were successful in most displacements that they attempted. European Starlings stood out as the species that initiated the most displacements, surpassing the next top contenders: American Goldfinch, Mourning Dove, and Blue Jay.
To see if these displacements and the birds themselves were influenced by the weather, we visualized the relationship between active precipitation (visibly raining or snowing) and three variables: (1) displacements; (2) number of individuals; and (3) number of species. The graphs seemed to show a potential pattern — there was a higher proportion of clips with a displacement when it was precipitating compared to when it was not. Even though precipitation didn’t appear to affect the number of individuals at the feeder, it did relate to the number of species.
To wrap up the data exploration, we created one last group of visualizations inspired by you, the Battling Birds community. We took note of the questions and ideas in the forums and Live Question and Answer Session (check out the recording here), and created graphs that dug deeper into weather, species presence, and displacements.
These community-inspired visualizations revealed preliminary evidence that the number of individuals and species does influence displacements at the feeder, and that other factors (ex: precipitation) are important to take into account when looking at this relationship.
With the first data set under our belts, we’d like to invite you to officially join us for Round 2! The first round explored 3 days from 2018 (January 1, January 16, and February 1). Let’s see if the patterns we’ve seen so far continue to hold if we add more days to our current data set.
Click here to start collecting data—we’re already 61% complete, and with your help we’ll complete round 2 and keep learning about how and why these birds are interacting. Thanks for your help and see you on Zooniverse!