Who’s Winning?
September 9, 2019Last week we figured out who is battling it out at the feeders–which species are initiating displacements and which are being targeted. This week we’ll explore one more facet of these displacements–whether or not displacement attempts were successful.
Click here to see the interactive version of this graph.
If you’ll recall, a displacement is when one bird (the “source”) tries to take over the position of another bird (the “target”), and a displacement can be successful or unsuccessful, depending on if the source bird dislodges the target bird.
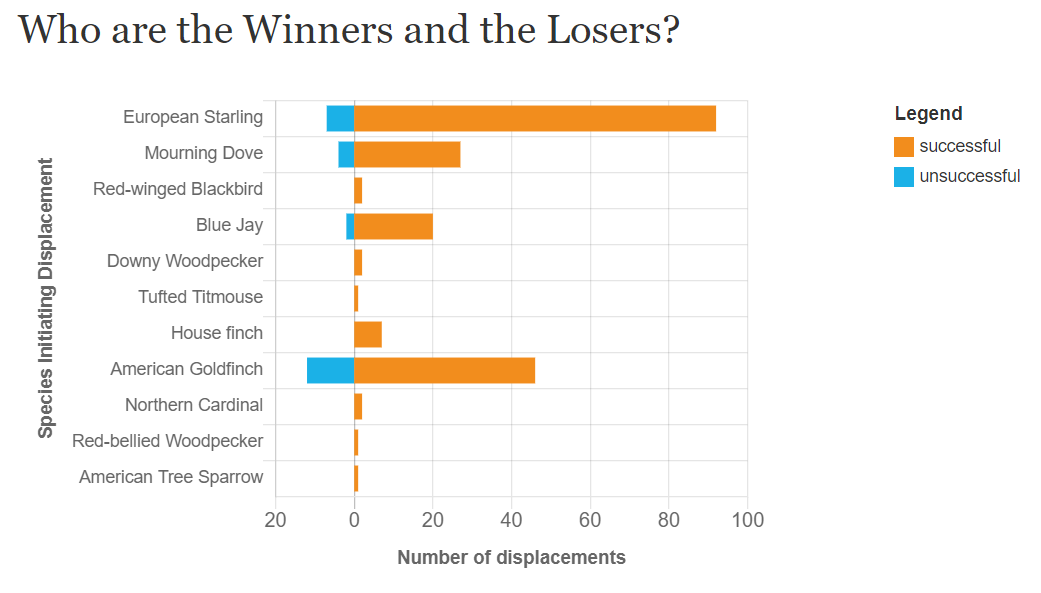
The above horizontal bar chart displays the number of displacements initiated by each of the species on the vertical axis. The orange bars refer to the number of successful displacements and the blue bars refer to the number of unsuccessful displacements.
Do you notice any patterns? If you take a look at the length of each of the bars, you might notice that most displacements were successful as opposed to unsuccessful. It also looks like the American Goldfinch had the most unsuccessful displacements. If you are wondering about which species American Goldfinches were successful or unsuccessful in displacing, make sure to check out its species-specific chart here.
Do you have any ideas as to why we might be seeing these patterns? Do you see any others?
Share your thoughts below and then play with an interactive version of this chart and others that dig even deeper here.