Results are in for Battling Birds!
April 24, 2020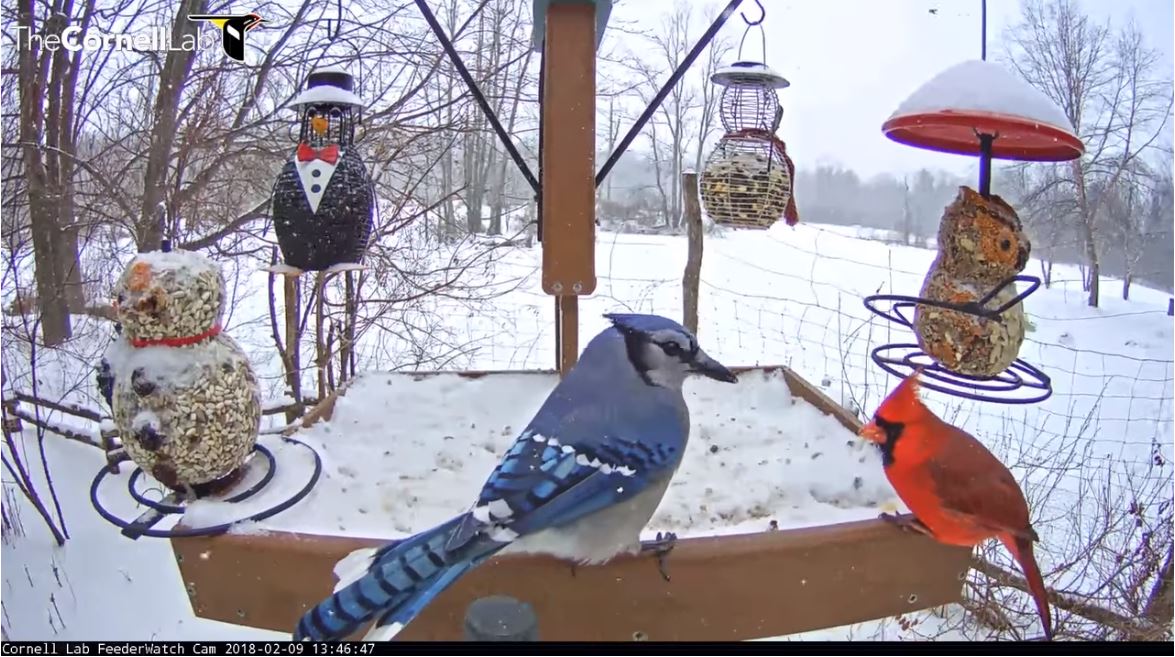
We are excited to share that, thanks to a tremendous effort from the Bird Cams Lab community, the second round of Battling Birds is complete and the results are in! First, we want to thank everyone who participated in the project. We could not have done it without you.
In 10 months, over 3,000 Battling Birds participants made more than 173,500 classifications from more than 25,000 video clips from the Cornell Lab of Ornithology FeederWatch cam. We’ve combined the data from the two rounds and are ready to share the initial findings. As always, your input is important and we encourage you to comment in the Disqus forum at the bottom of the page with your own interpretations or big takeaways.
We began the investigation with a question: how does the number of species and individuals affect behavioral interactions (specifically displacements) at a feeder? A displacement is when one bird takes over the resource, like food or a perch, occupied by another bird. There have been previous studies about dominance hierarchies at feeders that have been created by observing interactions like displacements, but there is a gap in what we know about how the number of individuals or species influences the occurrence of displacements at feeders.
With the added data from the second round of data collection, we found that a pattern that we saw in the interactive visualizations of data from the first round holds up: as the number of species or the number of birds increases, the percentage of clips with displacements also increases.
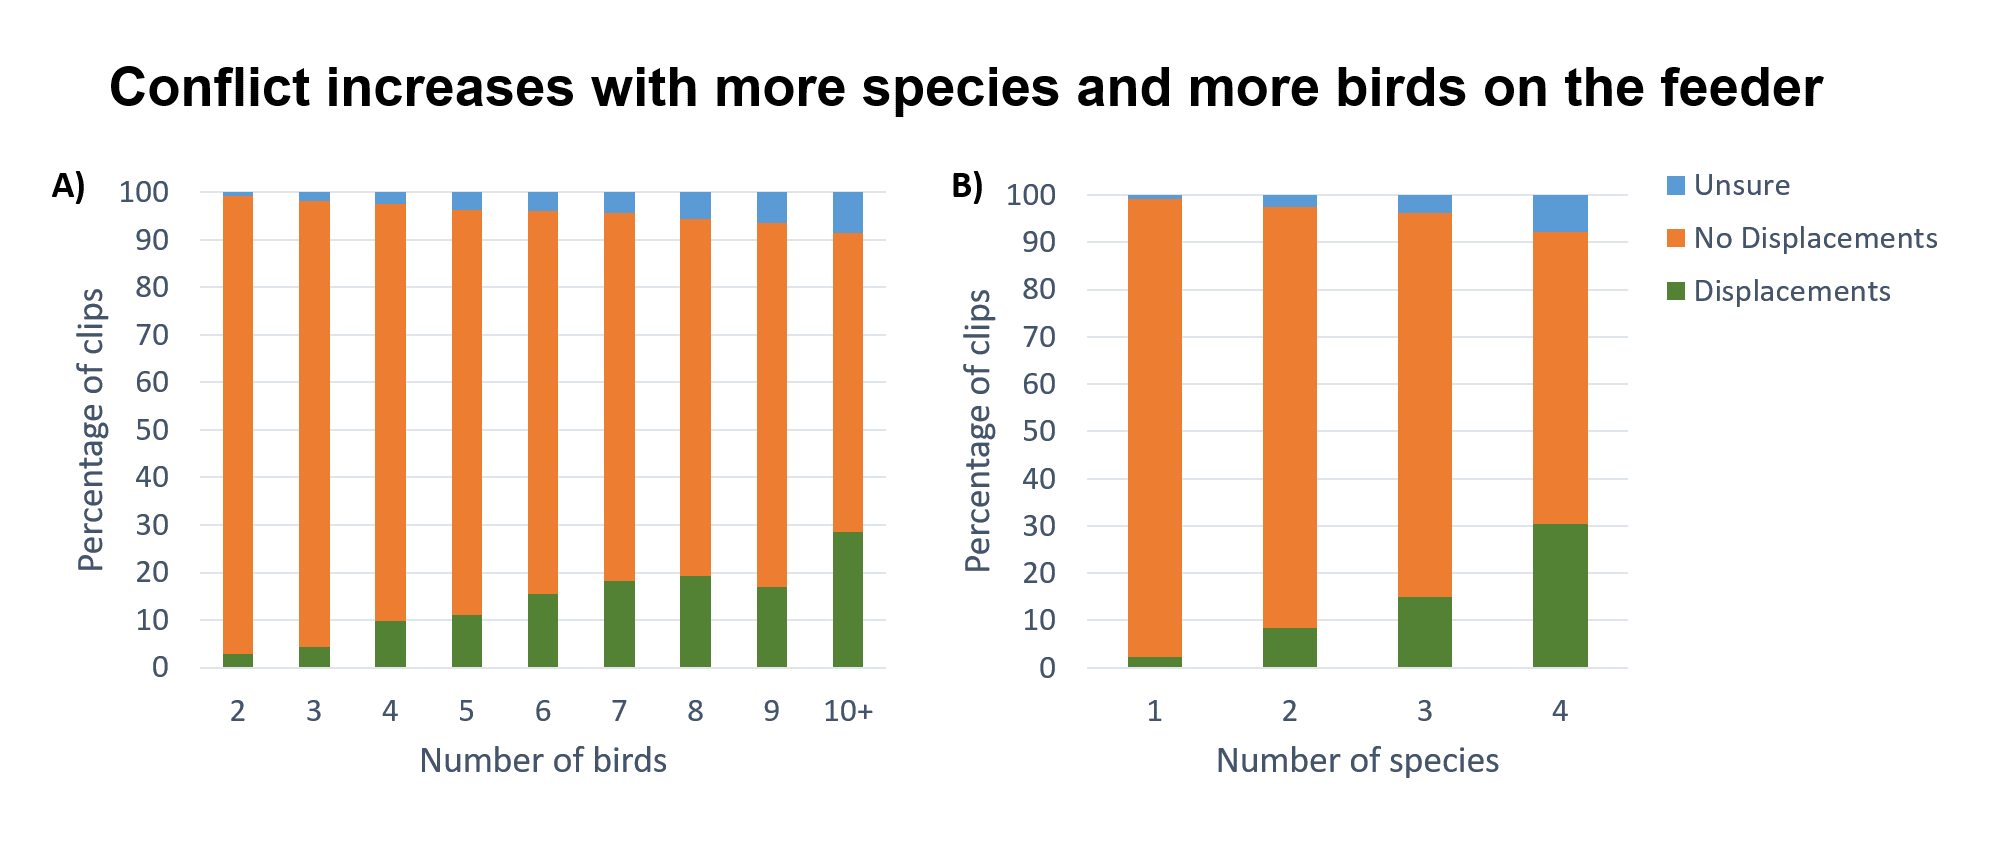
We might be seeing this pattern for a variety of reasons. Participant kittez suggested that the greater the number birds on the feeder, the less opportunity there is for an individual bird to get a seed and the more likely a displacement is to happen. Participant Patti Garret also pointed out an important consideration: the percentage of clips in which we are unsure as to what happened also increases, potentially due to the increasing difficulty of identifying displacements when there are more birds on the feeder. The more birds there are, the more difficult it may be to see what is going on.
There was also interest from the community to better understand how the number of species and number of individuals interact. Does the increase in the percentage of clips with displacements differ depending on both the number of species and birds together?

Regardless of how many species there are on the feeder, the percentage of clips with displacements increases as the number of birds increases from two to 10+. The rate of increase for when there are two or three species appears to be slightly higher than the rate of increase for when there is only one species. Kaliopi, one of the participants, pointed out an opportunity for a future investigation: to count the number of species and individuals during the displacement itself, not the maximum number seen during the video clip. This could be an even better assessment of the relationship between the number of birds and species and the chance a displacement occurs.
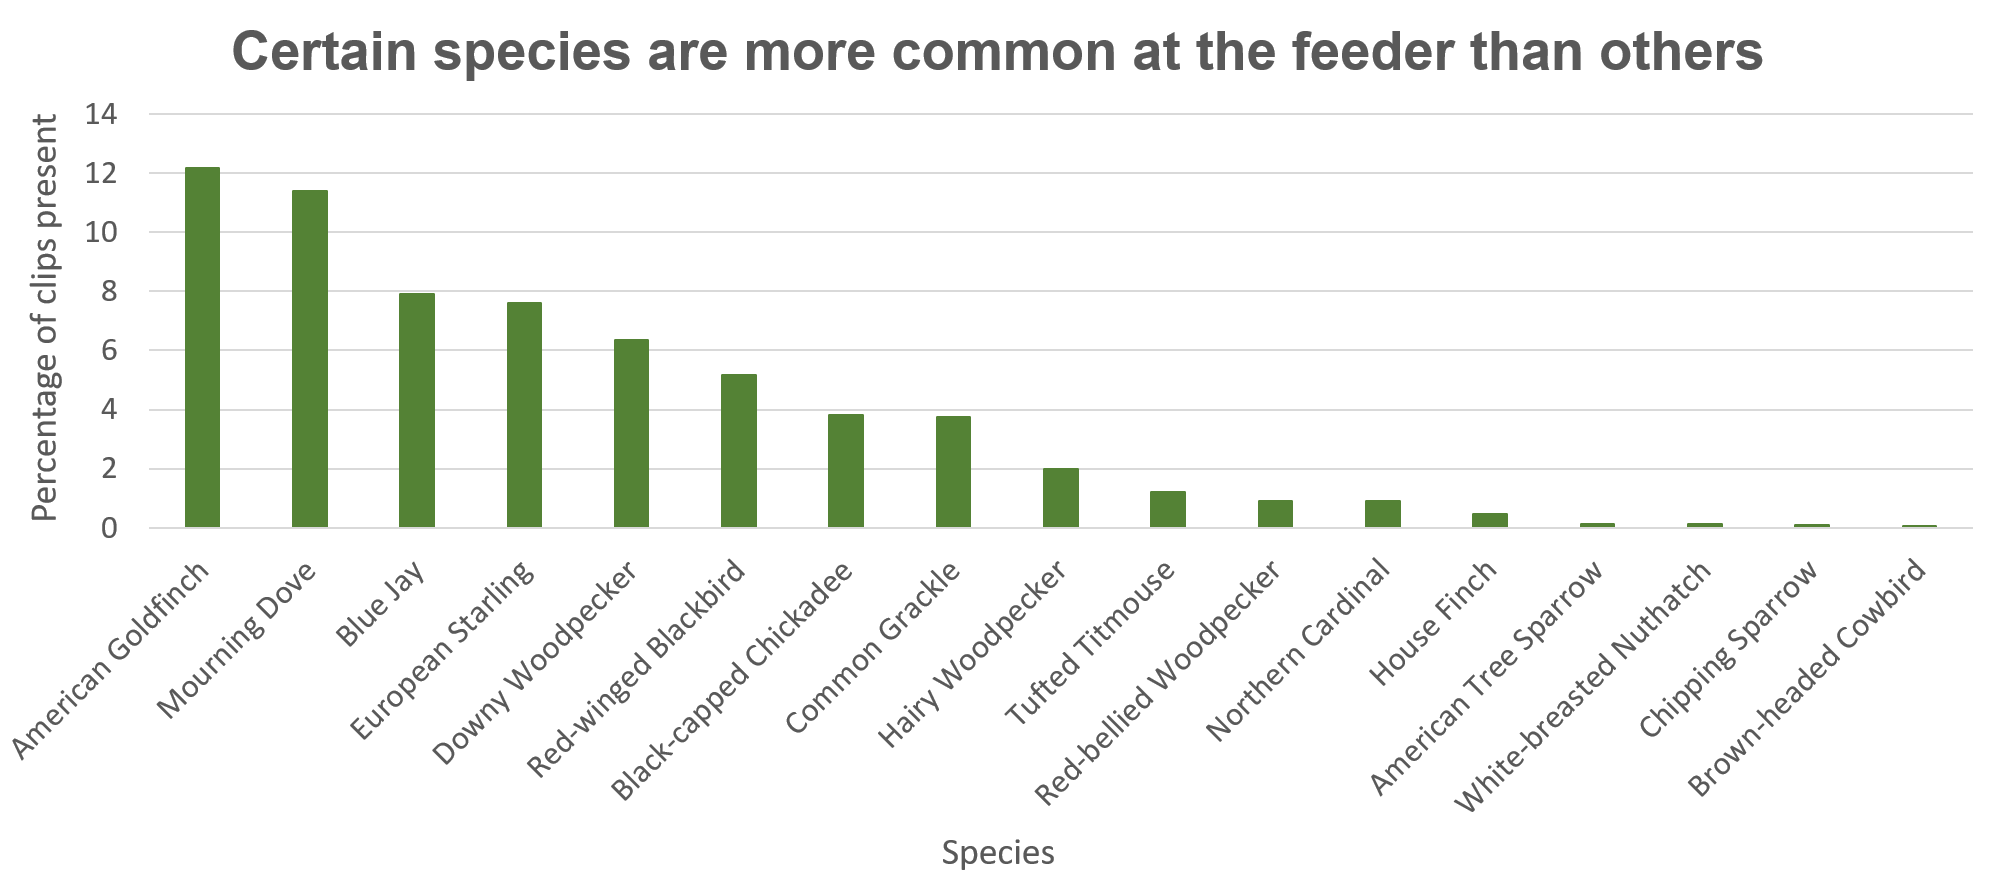
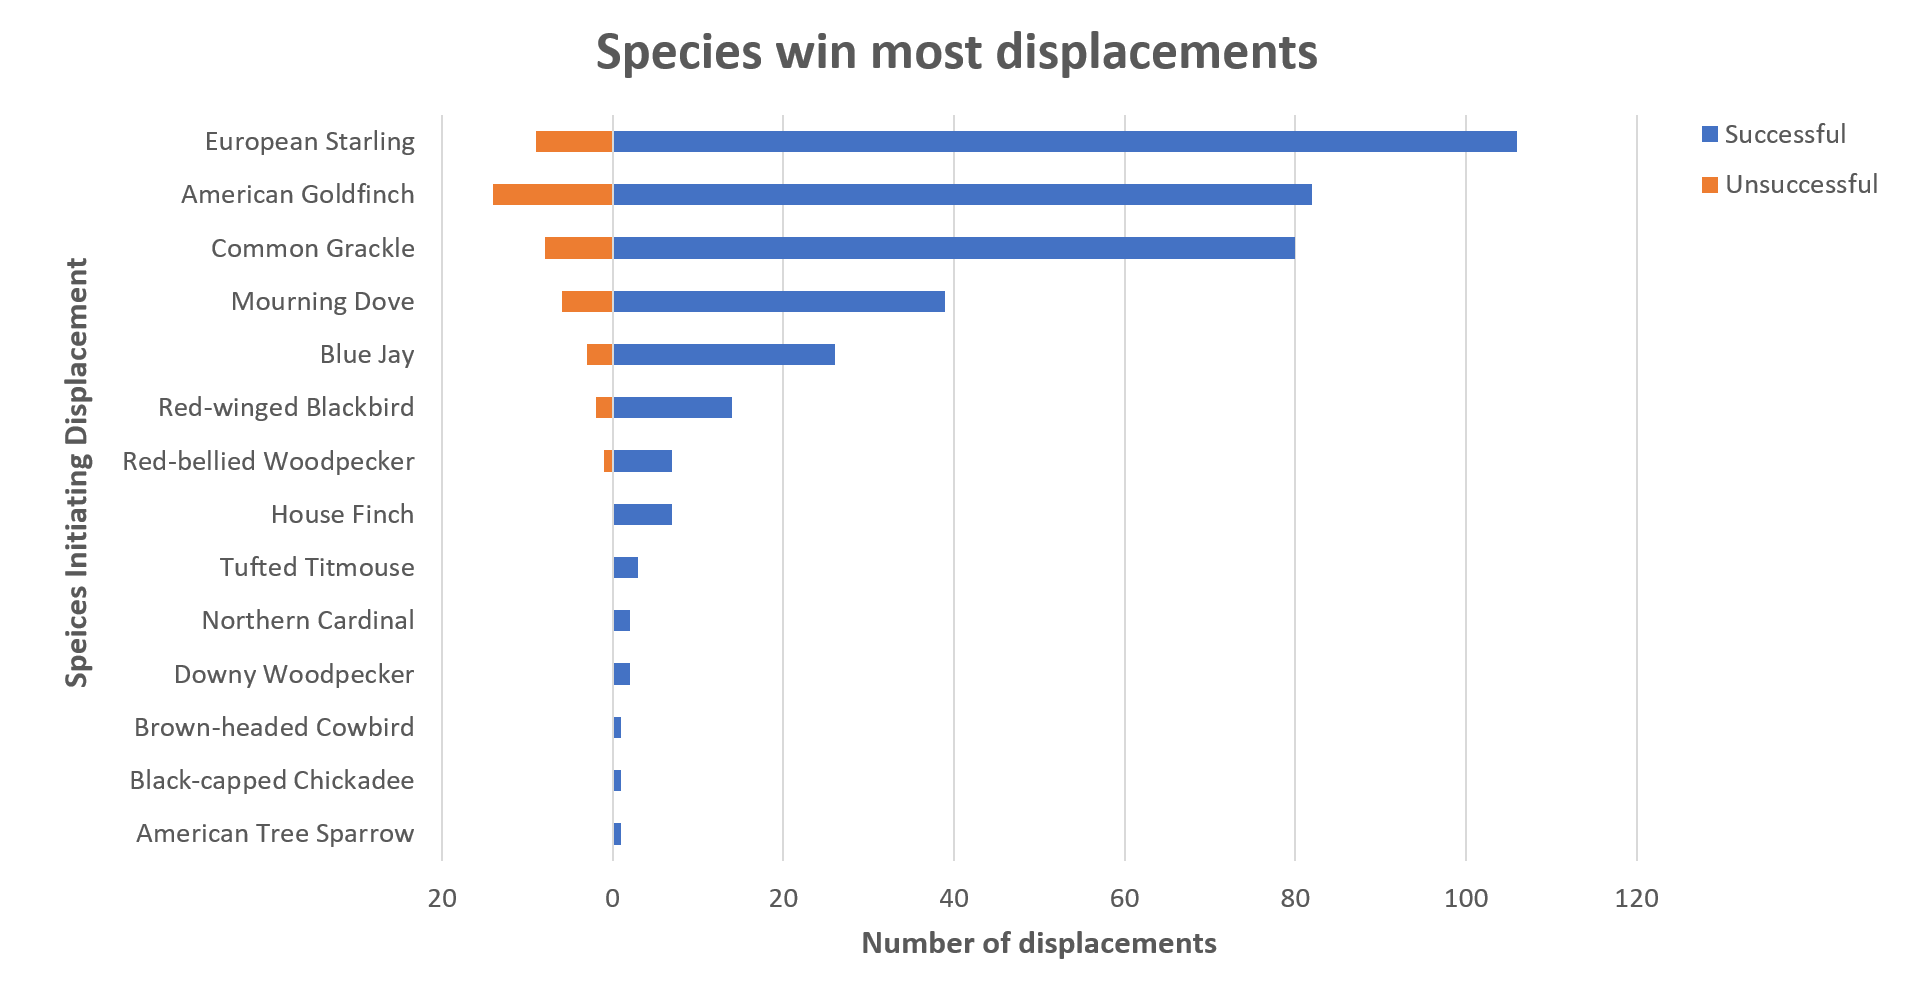
In addition to looking at the data that answered our main research question, we looked at which species were the most common at the feeder and which species initiated the most displacements. The top five common species at the feeder are the American Goldfinch, Mourning Dove, Blue Jay, European Starling, and Downy Woodpecker. Of these species, the Mourning Dove, European Starling, and American Goldfinch were also amongst the species initiating the most displacements. The Common Grackle and Blue Jay also initiated lots of displacements. Interestingly, for most species, more displacements were initiated against other individuals of the same species than against other individuals of a different species.
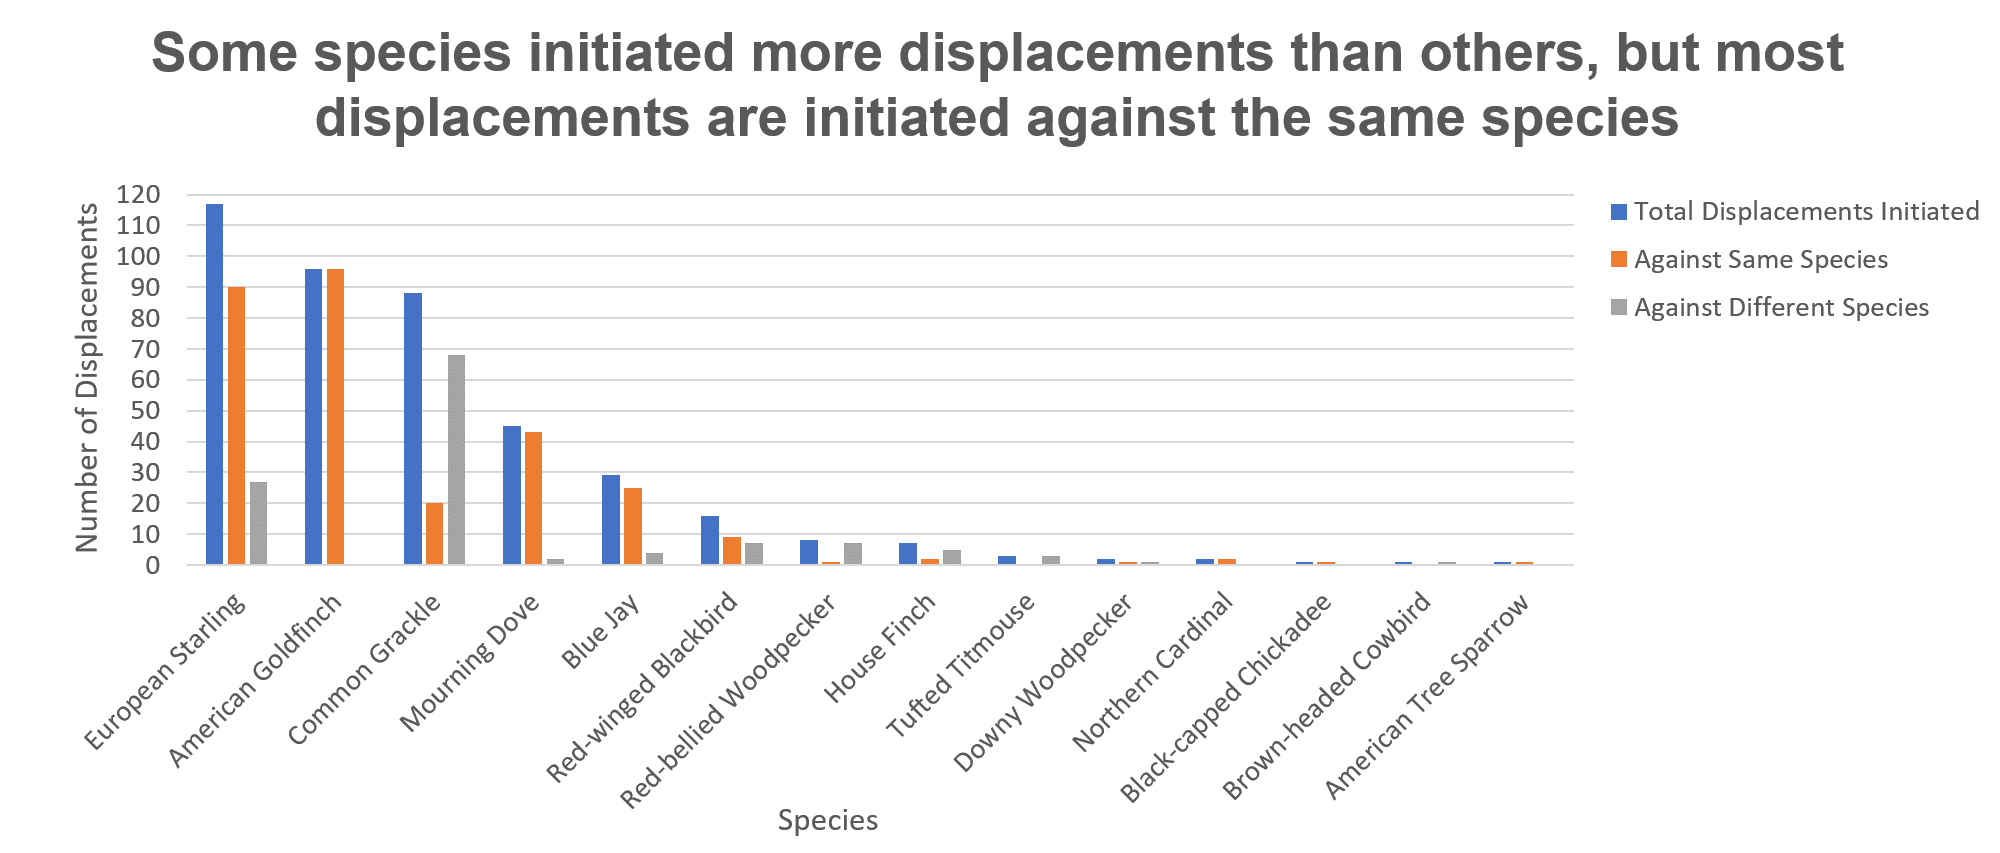
In general, most or all of the displacements species initiated were successful. Lambert Zijp commented in the forums that, “It seems aggression pays out (almost always successful). I wonder if I should learn something from this!” Perhaps individuals only initiate displacements if the chance that they will win is high. Alternatively, successful displacements may be easier for us to identify than unsuccessful displacements, which can be more subtle and hard to identify.
In summary, the more birds and the more species that there are on a feeder, the greater the chance a displacement will happen. Some species were more common, and some participated in displacements more than others. Most displacements were between two individuals of the same species and were usually successful.
Thank you to everyone who participated in Battling Birds, whether you collected data using the Zooniverse platform, posted in the Talk forums, or explored the results and shared your interpretations. A special thank you to Peter Mason, a Zooniverse volunteer and programmer who joined Bird Cams Lab to help extract the data from Zooniverse.
You might be wondering now, “What’s next?” This sharing out of results is an important and final step in this preliminary investigation. However, we may be able to investigate this question even further or a new question on the Cornell FeederWatch cam in the future.
Meanwhile, as of this writing, we have a new investigation starting up on the Red-tailed Hawk cam. Head over here to check out the project’s most recent updates. Or sign up on our email list to stay in touch about future opportunities.
Sign up today to stay up-to-date on all things Bird Cams Lab.
If you have any feedback or are interested in exploring the data further, please let us know!
Email us at birdscam@cornell.edu or comment in the forum below.
This project was funded by the National Science Foundation grant 1713225. Any opinions, findings, and conclusions or recommendations expressed in this material are those of the author(s) and do not necessarily reflect the views of the National Science Foundation.