Who’s Battling?
September 2, 2019Last week we looked at how the number of species at a feeder relates to how much conflict ensues. Now let’s dig into the details to find out which species are battling it out!
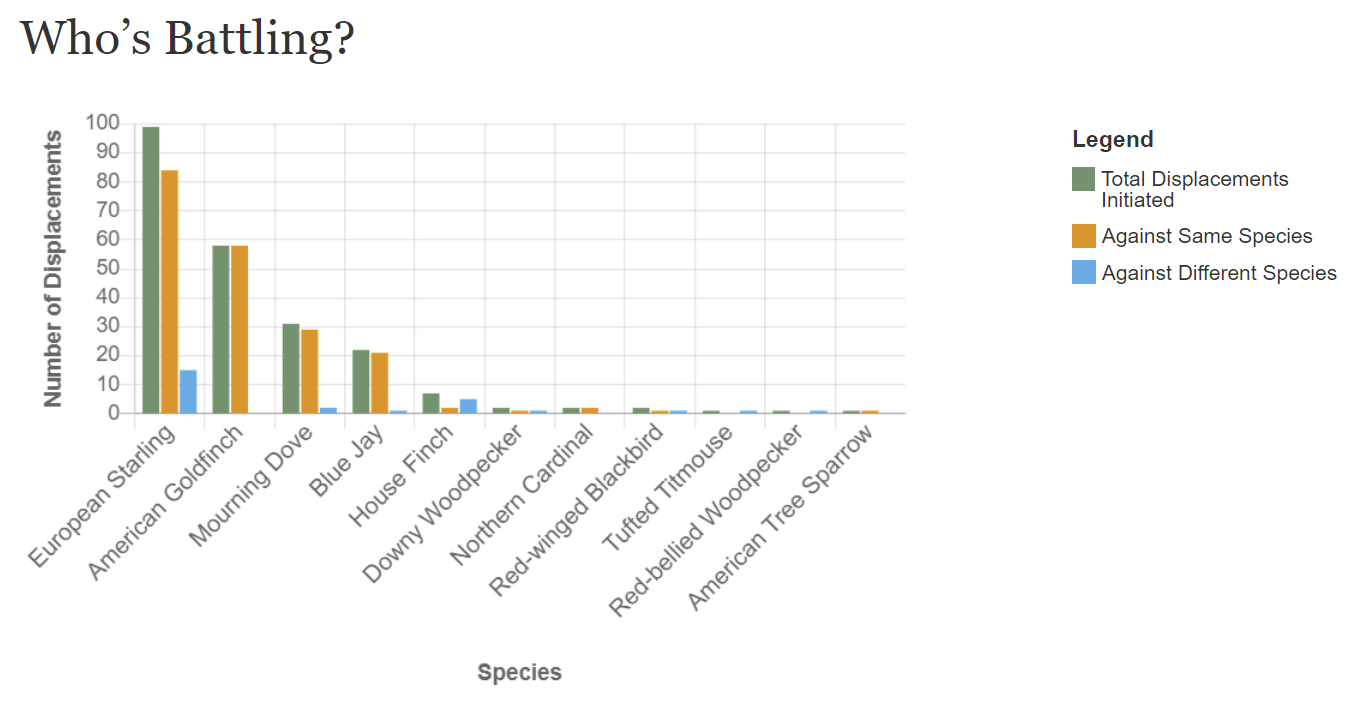
Today’s featured visualization shows how many total displacements each species initiated, and how many of these were against the same species or a different species. Recall that conflict at the feeders can be measured in different ways, but we decided to specifically look at displacements, or when one bird attempts to take over the food or perch of another bird.
Click here to see the interactive version of this graph.
Looking at the chart above, do you notice anything? Does one species initiate more displacements than others? Are species trying to displace their fellow species or are they targeting other species? Note that each color shows a category of displacements.
- Green = displacements a species initiates
- Orange = displacements a species initiates against its own species
- Blue = displacements a species initiates against other species
If you take a look at the height of each of the bars, there are interesting patterns! If we just look at the height of the green bars, we can see that the highest bar is for European Starlings. This means that European Starlings are initiating the most displacements out of all the species. If we compare the height of the orange and the blue bar within each species, we then notice that the orange bar is usually higher than the blue bar. This means that most displacements are happening within species, not between species.
Do you have any ideas as to why we might be seeing this? Do you see any other patterns in this chart?
Share your thoughts below and then play with an interactive version of this chart and others that dig even deeper here.