Battling Birds: From Zooniverse to Here
August 24, 2019

Battling Birds:
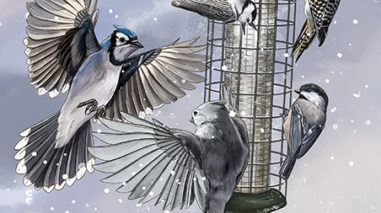
May 2018 – March 2020Participants watched clips from the Cornell FeederWatch cam to answer the question: How does the number of species and individuals affect displacements at the feeder? They found that displacements were more likely when more individuals or more species were at the feeder. To learn more, check out the Battling Birds Final Report. Illustration by Jillian Ditner
What actually goes on at your backyard bird feeder? Do the birds get along or do they fight? If you take a moment to watch your feeder, you might notice that it isn’t just peace and harmony, but some birds will be aggressive towards one another. In this social world, the larger birds are typically more “dominant” and the smaller birds more “subordinate” (see a recent study by Cornell Lab of Ornithology researchers that confirms this). What we still don’t know, however, is whether the number of birds or species composition changes how species interact at feeders. Does the number of birds and/or number of species at a feeder influence how these birds “battle” for their food? If so, how?
To find out, we collaborated with the Zooniverse community to watch and classify over 10,000 clips taken from the Cornell Lab of Ornithology’s FeederWatch Cam in a project called Battling Birds. Zooniverse is a free and easy-to-use platform that hosts hundreds of other citizen-science project. On Zooniverse, citizen scientists watched clips and recorded what they saw in each one: the number of birds, the number of species, whether there were aggressive interactions during the clip, and whether it was raining or snowing. We focused on a particular kind of aggressive interaction called a “displacement,” which is when one bird attempts to take the perch or food of another bird.
To our surprise, the community completed the project in under one month! At project completion, we had 1,795 logged-in participants who completed over 78,7000 classifications for over 12,000. Each clip was classified by 3-10 people before being completed. If 3 people watched a clip and recorded that there were no birds, the clip was considered complete; otherwise 10 people needed to watch the clip and classify what they saw.
Soon after, we set to work to extract the data from Zooniverse and decipher what all of the observations meant. The more people that watch a clip, the more accurate the data becomes. On the other hand, the more people that watch a clip, the more challenging it becomes to funnel these into a single data point. Many Zooniverse projects have taken up this challenge and there are now several different approaches to successfully do this.
With the help of Zooniverse volunteer and programmer Peter Mason, we figured out how to format the data and distill multiple classifications for each clip down to one observation. Since each clip was looked at by 3-10 participants and they didn’t always agree with what they saw, we needed to figure out a way to determine what actually happened. For example, out of 10 participants, 9 may have seen a displacement but one missed it. So 9/10, or 90%, saw a displacement and 1/10, or 10% saw no displacements. For each possible answer that participants collected data for, we calculated these proportions, which are called “vote fractions.”
Once we calculated these vote fractions, we employed a 60% threshold to determine what actually happened in each clip. For example, if 7 out of 10 participants (70%) classified that a clip had displacements, then we consider the clip to have displacements. If instead only 5 out of 10 participants (50%) classified that a clip had displacements and the other 5 participants classified that clip as only having birds, then we are not sure if there were any displacements.
We also used another technique to help make sense of conflicting observations called the “upper-median” to resolve instances when less than 60% of participants agreed on the total number of species, individual birds, and displacements in a clip. For example, if 50% of participants classified there being 2 displacements and the other 50% classified there being 1 displacement, we combine the vote fraction from the highest count downward until we reach 50%, or the median. Instead of resolving this as “unsure” we can conclude that 100% of participants agree that at least 1 displacement happened.
After translating the data viewers collected using this approach, we were left with 10,604 clips that we used to create exploratory data visualizations. Before any statistical analyses, it is important to explore what the data are telling us.
Interested in learning more about what these data mean? Join us as we begin exploring the data by heading over to this week’s Featured Data Visualization. Take a look at the data, explore different visualizations, and share your observations with the community. Your observations and conversations can help the Battling Birds community guide future analyses and topics to focus on.