 June 30, 2020Panama Live: From Observations to Visualizations
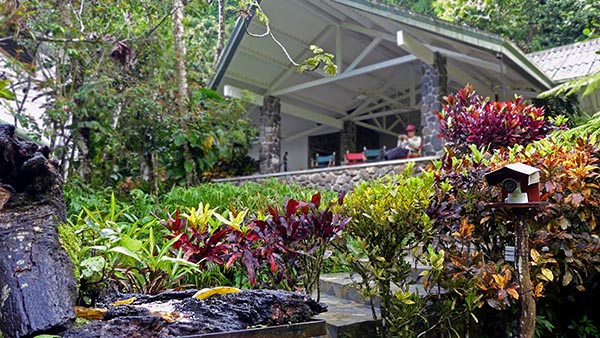
Panama is home to hundreds of tropical bird species, many of which we know very little about. The 24/7 Cornell Lab of Ornithology’s Panama Fruit Feeder Cam, located at the Canopy Lodge in the Anton Valley, gives us a window…
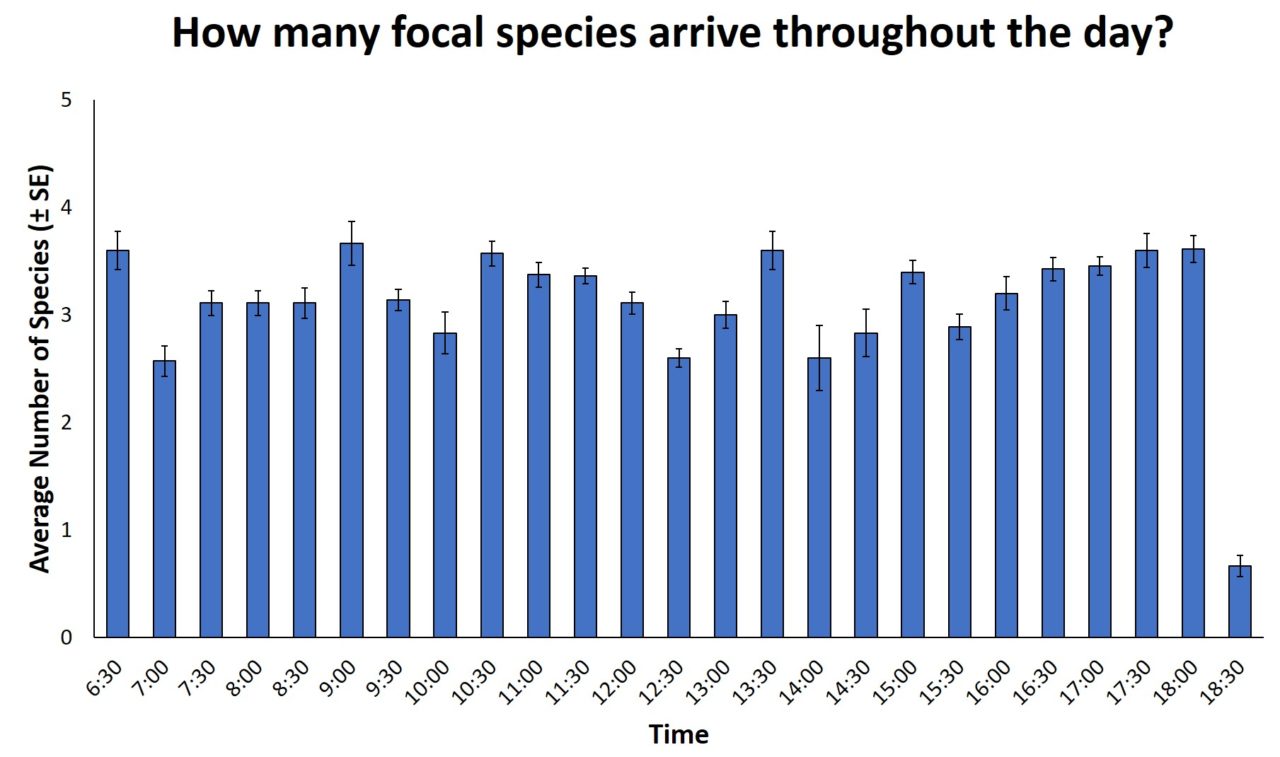 August 10, 2020How many focal species are arriving throughout the day?
Welcome to the first week of Panama Live Data Exploration!
Join us to dig into the data you collected to see what we can find out. Today, we’re featuring a visualization that looks at the average number of species arriving at…
 August 10, 2020See Preliminary Findings From the Panama Live Investigation
It’s finally time! Back in February, the Panama Live community came together and collected data to learn more about when certain bird species arrive at the feeder featured on the Panama Fruit Feeder cam. A huge thank you again to…
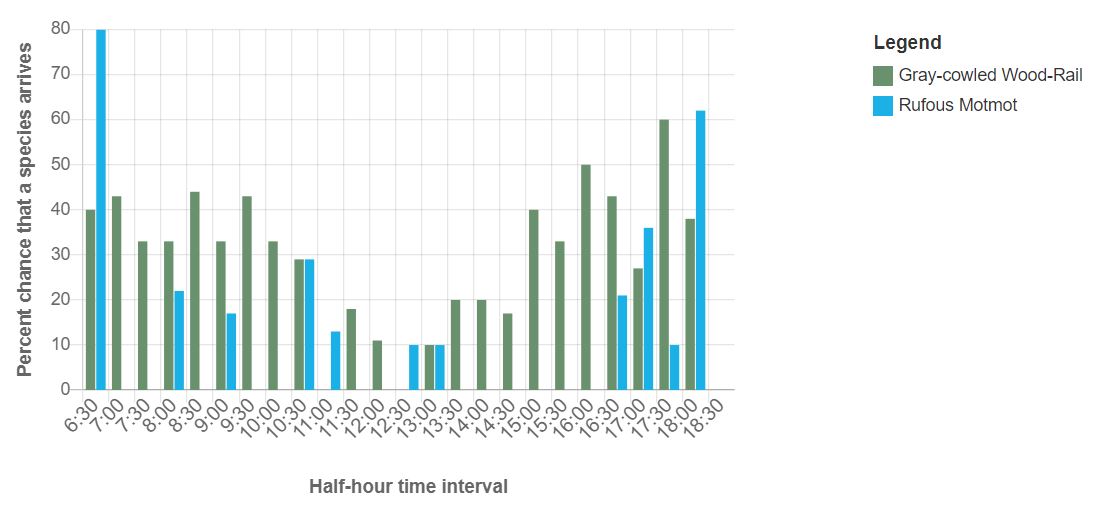 August 20, 2020Species differ in how they arrive at the feeder
When the Panama Live community discussed what to investigate, we narrowed the questions down to (1) when do six focal species arrive at the feeder, (2) does this vary from day to day, and (3) does adding food affect when…
 September 3, 2020Learn About Tropical Birds At Live Webinar
We had over 100 people weigh in to let us know when the best date and time would be to meet for our upcoming live event: Panama Live: Uncovering the lives of tropical feeder birds. Based on the responses, we’ll…
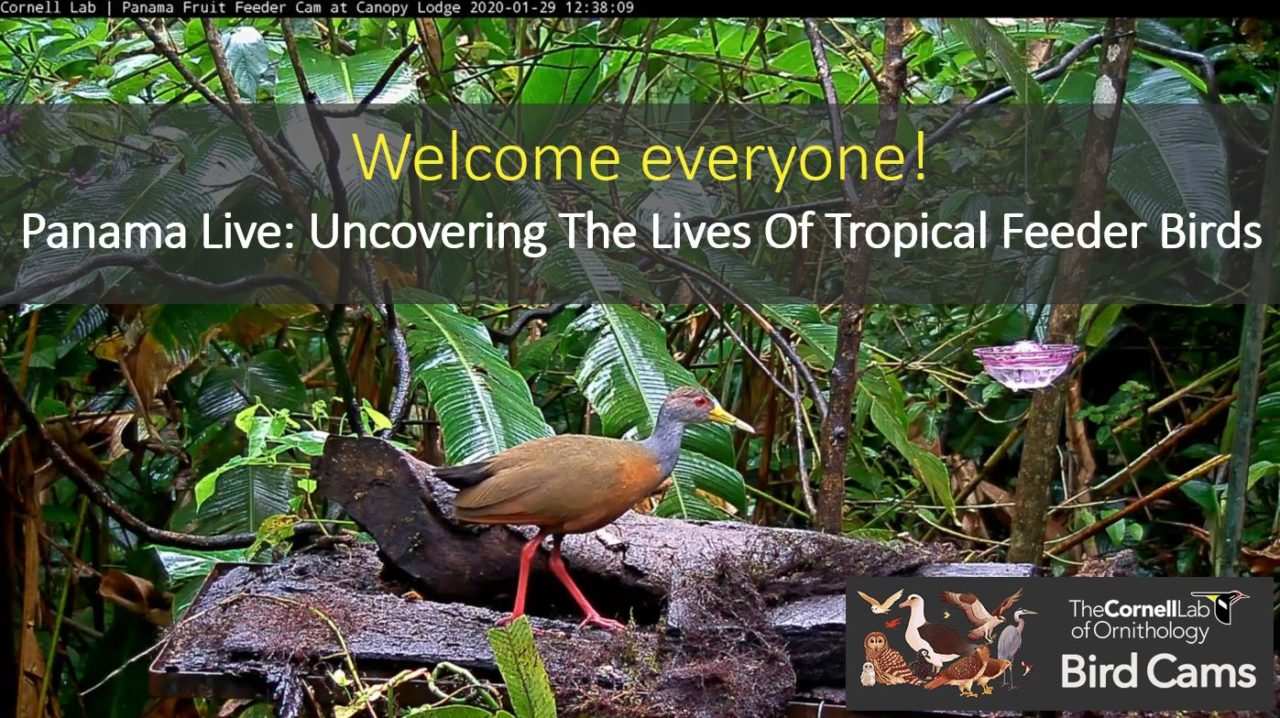 September 16, 2020Live from Bird Cams Lab: Virtual Event Uncovers the Lives of Tropical Feeder Birds
Over 100 people tuned in to join the Bird Cams staff on September 10th in a free virtual event, “Panama Live: Uncovering The Lives Of Tropical Feeder Birds.” In the course of an hour, we watched video clips of six…
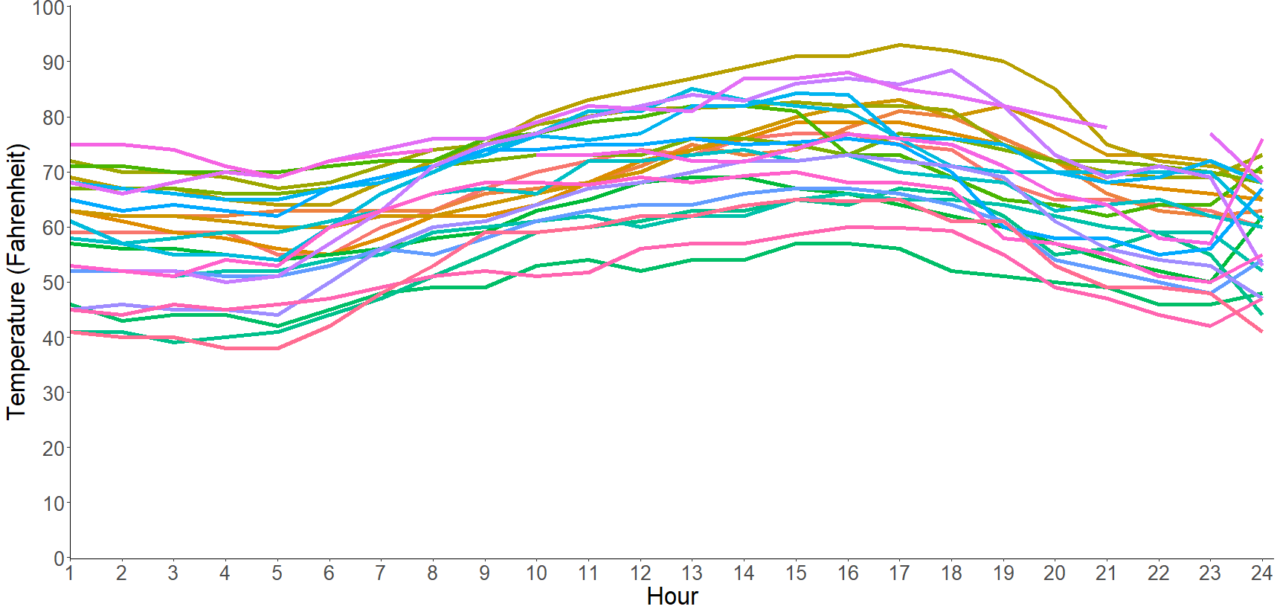 September 18, 2020What does the weather data look like?
Weather is important to understand when studying birds because it can potentially affect how they behave. The Hawk Happenings community recognized this and specifically included weather in their research question, theorizing that Red-tailed Hawk behaviors at the nest might vary…
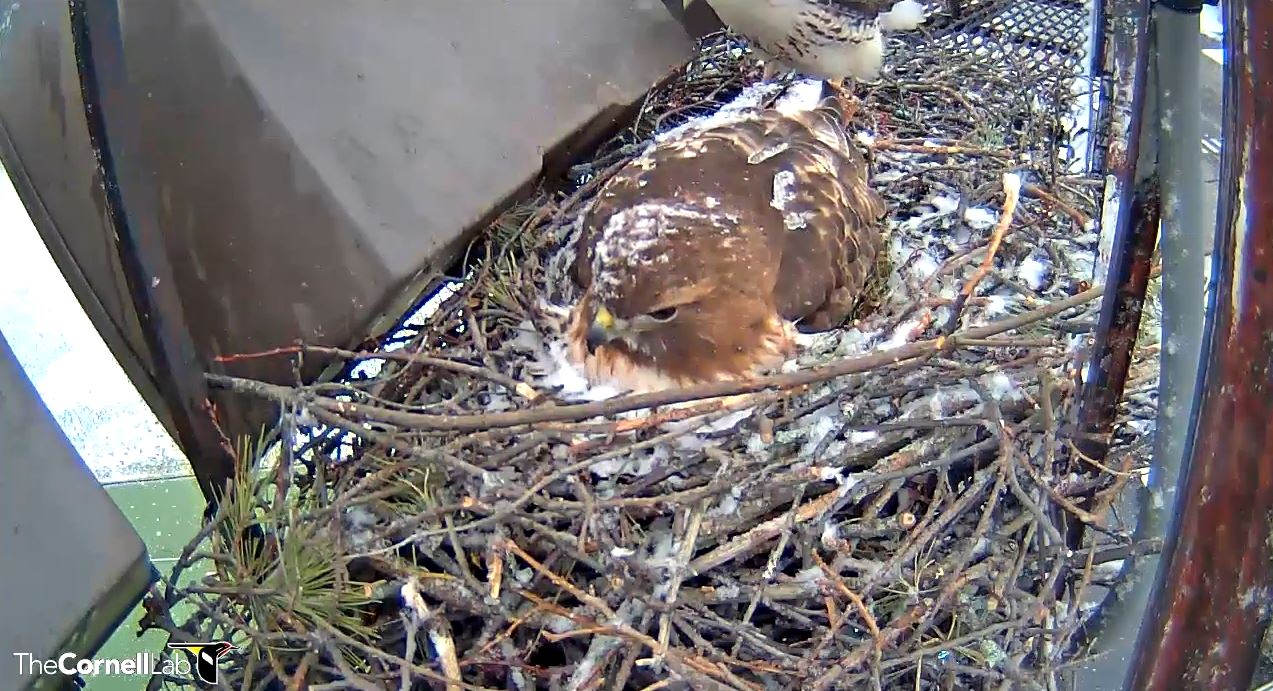 September 20, 2020Hawk Happenings: From Observations to Visualizations
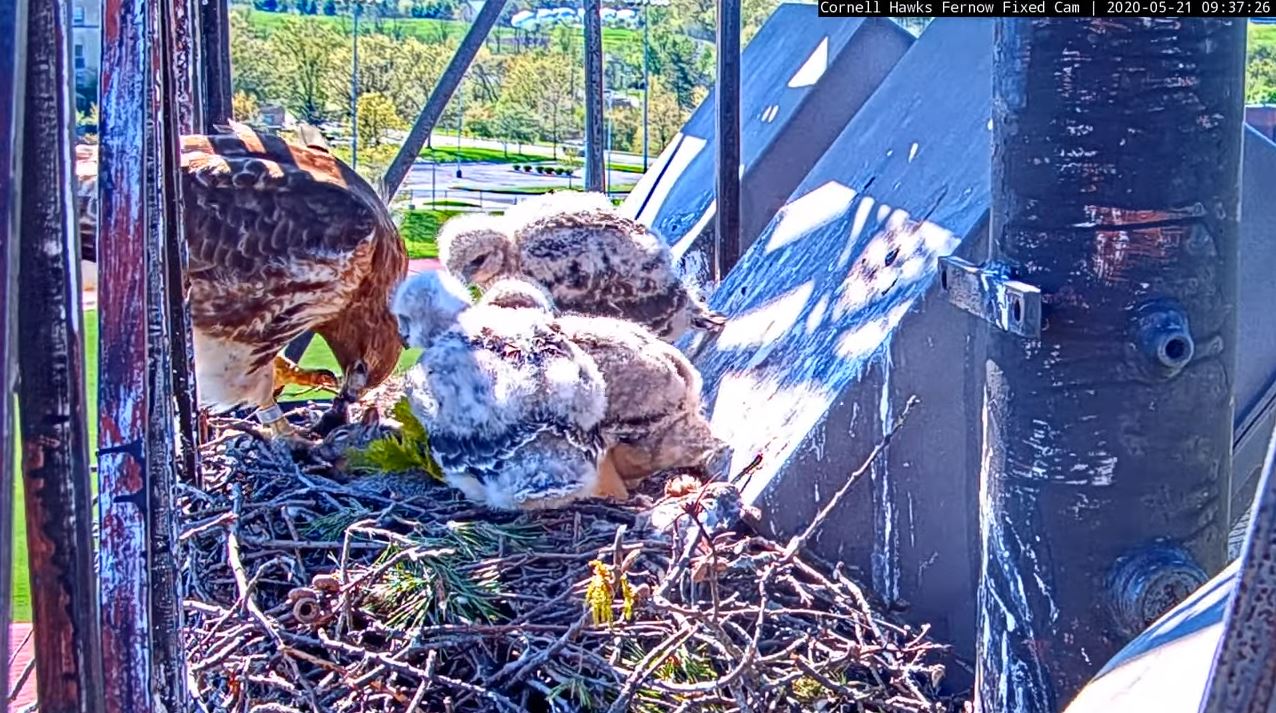
Although the Red-tailed Hawks are one of the most common hawks and are found across North America, researchers have only been able to study their behaviors at the nest from afar or infrequently via quick nest checks. The Cornell Lab’s…
 September 22, 2020Community inspires deeper dive into the data
The Panama Live community inspired us to dig deeper into the data and create a new set of visualizations! During last week’s live webinar, Panama Live: Uncovering The Lives Of Six Tropical Feeder Birds (watch it here if you missed…
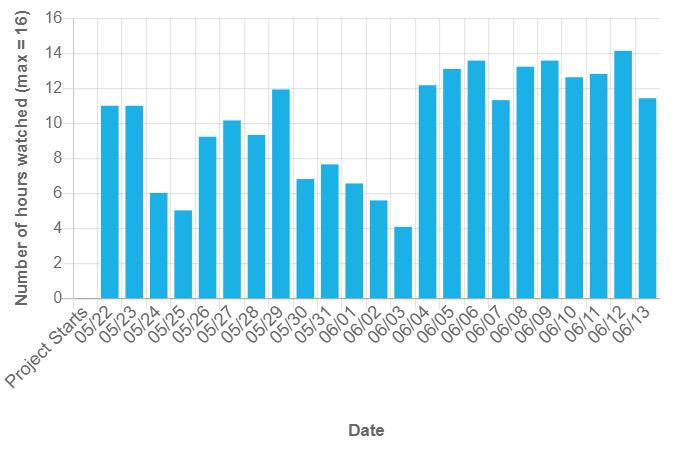
 October 2, 2020When were (or weren’t) we watching?
In the midst of the pandemic this past summer, the community came together and connected with nature by collecting data on the Cornell Lab’s Red-tailed Hawk cam. From May to June, over 320 people collected data to better understand the…
 October 2, 2020Explore the Hawk Happenings Data
The time has come! Join us in the next phase of Hawk Happenings: data exploration. We’ve completed the first three phases (observe, question, and collect data), and it’s now time to look at data visualizations. Regardless of your involvement with…
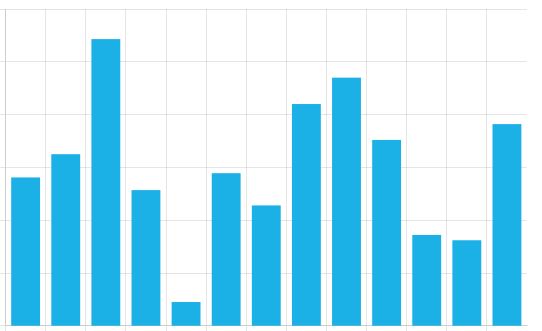
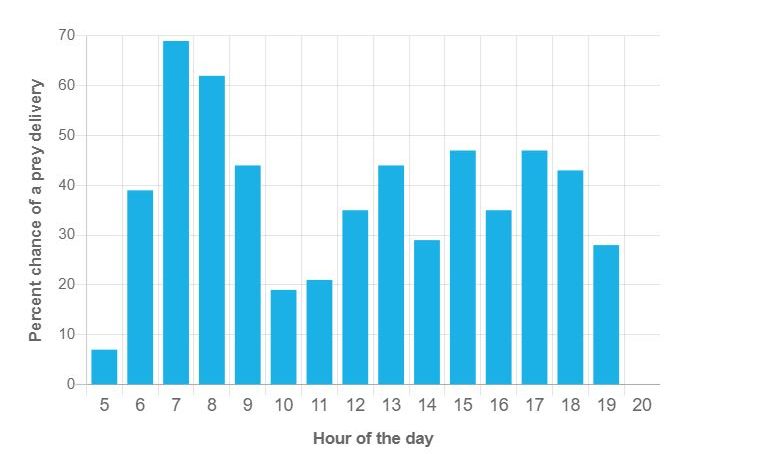 October 13, 2020Nestlings snack all day on the prey delivered in the morning or afternoon
Last week we released the first set of visualizations that looked at participants’ sampling effort and the first behavior we studied: vocalizations. This week we dive into the other intriguing and fun-to-watch behaviors: feedings, prey deliveries, and three nestling-specific ones…