Explore the Hawk Happenings Data
October 2, 2020
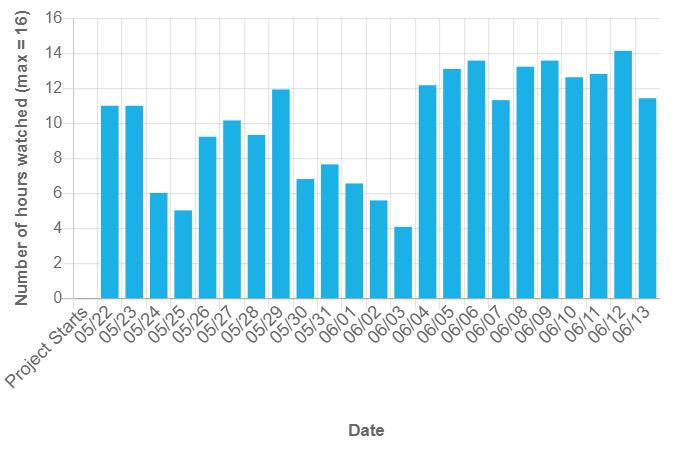
The time has come! Join us in the next phase of Hawk Happenings: data exploration. We’ve completed the first three phases (observe, question, and collect data), and it’s now time to look at data visualizations. Regardless of your involvement with Hawk Happenings so far, we invite you to explore the data, ask questions, and share your thoughts with the community. To get the ball rolling, we’ve highlighted one visualization in a featured blog post.
