When were (or weren’t) we watching?
October 2, 2020
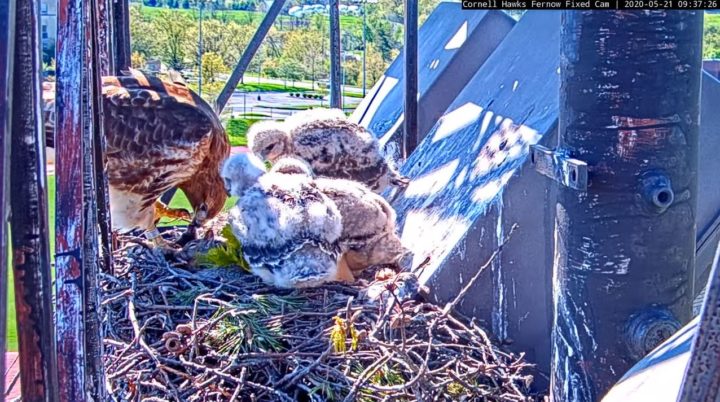
In the midst of the pandemic this past summer, the community came together and connected with nature by collecting data on the Cornell Lab’s Red-tailed Hawk cam. From May to June, over 320 people collected data to better understand the frequency of certain hawk behaviors and how the frequency might vary with weather.
We were excited to use our live data collection tool to record when the behaviors happened in real-time on the cam (see this quick tutorial on how the tool works). At the end of data collection, the community amassed over 12,500 observations about the hawks’ behavior in the nest! But before we could visualize the data about the hawks’ behavior for us to explore, we realized that—like in any scientific investigation—we needed to consider the sampling effort.
For this investigation, sampling effort reflects the amount of time spent watching the cam and collecting data. Sometimes more than one person was watching and collecting data, so we decided it was important to examine the amount of time at least one person was watching and collecting data.
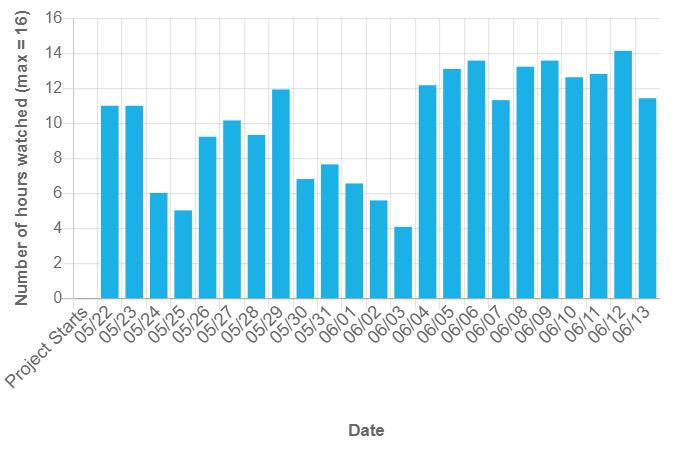
We’ve summarized this sampling effort across time in two ways: by day and by hour each day. Below is the first in the set of “Time Watched” visualizations, displaying the number of hours watched by at least one person each day during the data collecting period.
 Figure 1. A bar chart showing the number of hours watched each day by at least one participant during the Hawk Happenings data collection period. The date advances from May 22nd to June 13th on the horizontal axis and the number of hours watched increases from four to sixteen on the vertical axis. We only considered daylight hours, approximately from 5:00 A.M. to 9:00 P.M.
You’ll notice that how much time was spent watching and collecting the data varied from four hours on June 3rd to just above fourteen hours on June 12th. Because we focused on daylight hours, the maximum amount that could be watched in one day is 16 hours, which was close to being reached in the second half of the data collection period from June 4th onward.
Visualizing the variation is crucial. If we look at the visualizations about vocalizations and see that there are, for example, less vocalizations on May 25th compared to May 26th, that may be because there really were less, or it could be because we watched the cam less (i.e. less sampling effort).
We invite you to explore the first round of interactive visualizations about the time watched and vocalizations at the nest. See what patterns you can find in the data and be a part of this next phase in the Hawk Happenings investigation: data exploration. Your input is valuable in understanding what the data mean and how we can begin to answer our research question.
Please share your questions and thoughts about below.
