Hawk Happenings: From Observations to Visualizations
September 20, 2020
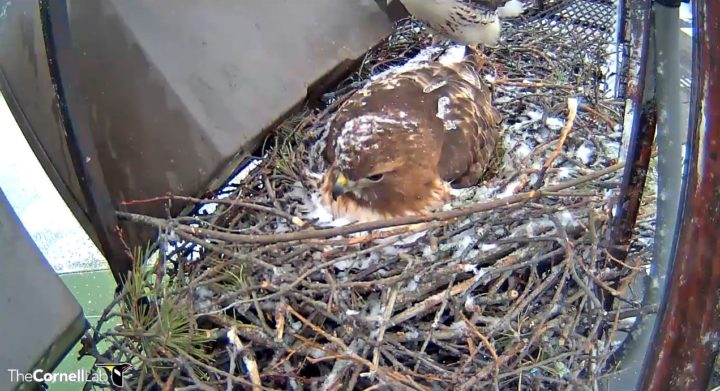
 Big Red, the female, incubates eggs while it snows.
Although the Red-tailed Hawks are one of the most common hawks and are found across North America, researchers have only been able to study their behaviors at the nest from afar or infrequently via quick nest checks. The Cornell Lab’s Red-tailed Hawk cam provides a unique opportunity for viewers to watch these birds up close and make new discoveries. This past year, Red-tailed Hawk cam viewers teamed up with Bird Cams Lab scientists to answer the question, What is the frequency of certain hawk behaviors, and does this frequency vary with the weather?
We collected data in real time on the cam and this presented two interesting challenges for understanding and analyzing the data: (1) multiple people could watch at the same or different times, and (2) multiple people could log the same event?
Data collection
We focused on six behaviors for data collection: vocalization, prey delivery, feeding, and a series of nestling-specific behaviors (flapping, walking, food defense). While we initially collected data on brooding, we swapped it out for nestling-specific behaviors because brooding happened less and less frequently. Brooding is when the adults sit on top of the nestlings to help them maintain their own body heat, or thermoregulate, and as the nestlings get older, the adults need to do that less and less.
We collected data in real time using our live data collection tool (see how it worked in this short video). Over 320 people contributed to the effort by watching the Red-tailed Hawk Cam live and clicking buttons whenever they saw one of the six behaviors. After collecting data from May 21 to June 14, we amassed a total of over 12,500 observations.
We then set to work addressing the challenges that come with collecting data live from the cam. Multiple people could watch the cam and collect data at the same time or different times from day to day. When people watched and collected data at the same time, their clicks may not have matched up because there is a delay between when something happens and when each of us clicks the button to report it.
Challenge #1: When were people watching the cam?
To be sure when the cam was and was not being watched, we limited the data set to only include participant sessions with a clear “start” and “stop” time indicated by clicking the “End Data Collection” button. Then, to help us understand the sampling effort, or the amount of time that at least one participant was watching the cam and collecting data, we created a set of visualizations. By looking at how much time was watched by date and by the hour each day, we got a sense of how sampling effort varied with time. A better understanding of sampling effort helps us understand whether changes in behavior, like vocalizations, reported on one day compared to another are more likely because we watched the cam for different amounts of time or because there were actually more vocalizations at the nest.
Challenge #2: How to interpret multiple observations for a single event?
We divided the dataset into subsets for each behavior and “binned” behavioral observations that were within one-minute of each other, using the first recorded time to indicate when that behavior occurred. For example, if one person marked that prey was delivered at 6:00:00 A.M. and another person marked that prey was delivered at 6:00:30 A.M., then the two observations became one prey delivery observation. With these “binned” datasets in hand, we figured out the total number of times each behavior occurred by date or hour. Additionally, we were able to calculate the percentage chance each behavior occurred during each hour.
To calculate the percentage chance, we performed a series of steps. For each hour interval, we determined how much of it was watched by one or more participants. If 30 minutes or more were watched, we considered that interval “watched.” Then, we assigned a “1” if the behavior was observed (present) and a “0” if it wasn’t (absent), creating a “presence-absence” dataset. Once we had that, we calculated the probability, or percentage chance, that a behavior would happen during each hour time interval. For example, from 6:00 – 7:00 a.m., if a hawk vocalized during that time interval for four days and the total number of days participants watched that interval was eight days, then the probability would be 4/8 or 0.50. To turn that number into a percentage we multiply by 100.
Weather data
In order to match this behavioral data to the temperature data, we reached out to the closest weather station, located at the Cornell Apple Orchards. The weather station recorded the hourly average temperature, but there were gaps in the data due to technological malfunctions. To supplement that dataset, we also obtained data from the next nearest weather station at the Ithaca Airport, where temperature was recorded right before the top of every hour. You can see what the weather data looked like here.
We’ve purposely summarized the biological data (weather and hawk behavior) and methodological data (time watched) in multiple different ways to give us the chance to understand the data and any underlying patterns within. As with any scientific investigation, we need to visualize the data before we can perform the statistical analyses.
We invite and encourage everyone to explore the interactive visualizations. Please share your thoughts and questions in the forums below each visualization. Your observations and conversations are an important part of summarizing preliminary findings in the final report for Hawk Happenings.