How many focal species are arriving throughout the day?
August 10, 2020Welcome to the first week of Panama Live Data Exploration!
Join us to dig into the data you collected to see what we can find out. Today, we’re featuring a visualization that looks at the average number of species arriving at a feeder throughout the day.
For about two weeks in February, participants recorded when individuals birds came into view on the Cornell Lab of Ornithology’s Panama Fruit Feeder Cam. They focused on collecting data on six species: Clay-colored Thrush, Crimson-backed Tanager, Gray-cowled Wood-Rail, Gray-headed Chacalaca, Rufous Motmot, and Thick-billed Euphonias.
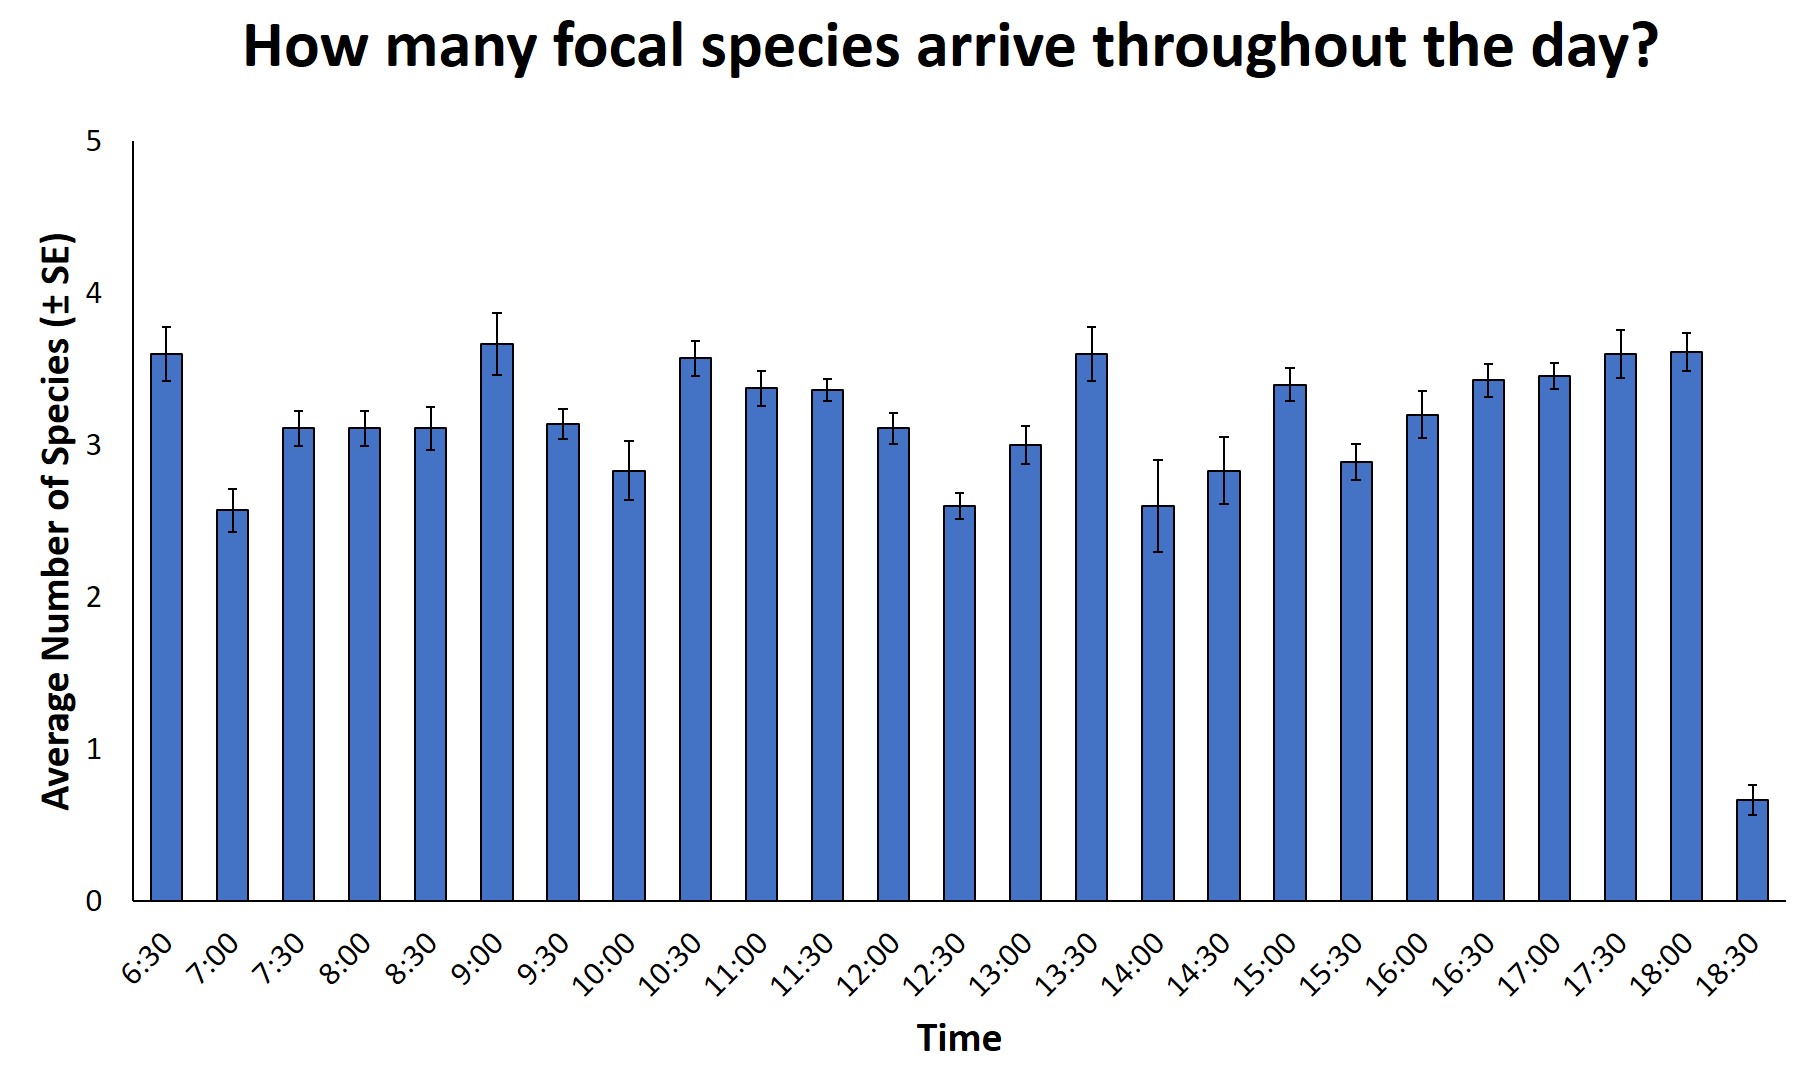
This chart helps us start to answer our first research question: When do focal species arrive at the feeder? The height of each bar is the average number of the six possible species seen during that half-hour time interval across the data collection period with standard error (SE) bars. Standard error bars help us see the spread of the data around the average (i.e. large error bars represent that the data deviates from the mean to a greater degree than small error bars). The times on the horizontal axis are the start of a half-hour time interval and in a 24-hour format (i.e. 18:30 is 6:30 p.m.).
The average number of species present at the feeder varied at different times throughout the day, but doesn’t seem to vary greatly from the overall average of three species. There doesn’t appear to be one part of the day in which there are more species than another, except for at the end of the day when approximately one species was typically observed. However, this is just the tip of the iceberg!
We invite you to explore the interactive visualization we’ve created to see what the data can reveal! Explore how individual species differ and how things change (or don’t) with respect to time, day, or when food is on the feeder.
Share your thoughts about this graph below and then explore the interactive visualizations we’ve created to see what the data can reveal. Explore how patterns do or do not change with time, and how individual species compare.