Panama Live: Final Report
November 17, 2020Key Takeaways
- Panama Fruit Feeder cam viewers teamed up with scientists to co-create an investigation to learn more about when six species arrive at the feeder seen on cam.
- Sixty cam viewers collected data live from one of the Cornell Lab of Ornithology’s online Bird Cams for the first time.
- In exploring the data online and in a live webinar with scientists, the Bird Cams Lab community helped uncover new insights into the feeding behaviors of these birds.
- Species varied considerably in their feeder arrival patterns. For example, the Clay-colored Thrush was at the feeder most of the day while the Rufous Motmot was most often at the feeder in the morning and evening, not midday.
- There was also variability in the timing of arrival of different species after food was replenished. Surprisingly, the Gray-cowled Wood-Rail had a delayed arrival to the feeder after food was replenished. Could it be because they were avoiding other species, or cueing into the presence of other species as a sign that food was there?
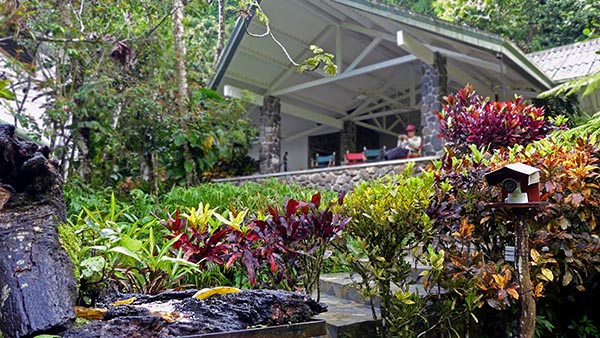
Figure 1.The feeder (bottom left) seen on the Panama Fruit Feeder cam (bottom right) with the Canopy Lodge in the background.
Background
Since 2018, viewers from around the world have come together and formed a community to watch and learn about birds on the Cornell Lab of Ornithology’s Panama Fruit Feeder cam. The cam features a feeding platform located on the grounds of the Canopy Lodge in El Valle de Antón, Panama, where the staff fill the feeders with fresh fruit throughout the day. Those tuning in are greeted by spectacular views of tropical birds, mammals, and even butterflies.
The online Bird Cams give us a 24/7 window into the lives of many species at their nests and at feeders that we might not otherwise be able to observe. The Bird Cams Lab project, supported by the National Science Foundation, enables online cam communities to reveal new insights by joining any or all phases of the scientific process: observing birds, asking questions, designing a study, collecting data, and exploring and interpreting results.
In November 2019, the Bird Cams Lab team invited the Panama Fruit Feeder cam viewers to participate in “Panama Live,” a scientific investigation co-created by viewers and scientists using the live-streaming Panama Fruit Feeder cam. .We kicked off the investigation in a forum titled the “Wonder Board,” where scientists and 14 participants discussed what they saw on cam and potential questions to investigate.
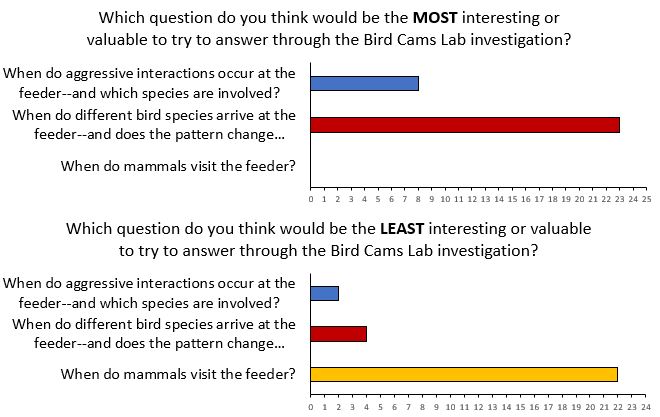
After weeks of discussion, the online community, together with the scientists, took a vote. The question that rose to the top was about the birds’ pattern of arrival at the feeder (Figure 2). Although many of the bird species visiting the feeder are considered common on the Panama Fruit Feeder cam, scientists know very little about their daily foraging patterns at feeders, so the results of this investigation would help contribute insights about these birds’ behaviors.
The Bird Cams Lab community continued the conversation for another few weeks in a second forum, “Question Design,” where eight viewers worked with scientists to refine the main research question and design the best way to collect data. The discussion centered on questions such as “Which is the best species to focus on?” and “Should we measure other variables like weather or the timing of food?”
In January 2020, we took a final vote to solidify the data collection details and the wording of our research questions. After 36 people voted, our final research questions were,
- When do focal species arrive at the feeder?
- How does this vary from day to day?
- Does the timing of food affect when birds arrive at the feeder?
To make data collection more tractable, given that more than 60 bird species visit the feeder, the community of viewers and scientists chose six species to focus on, including recognizable and frequent visitors: Clay-colored Thrush, Crimson-backed Tanager, Gray-headed Chachalaca, Gray-cowled Wood-Rail, Rufous Motmot, and Thick-billed Euphonia.
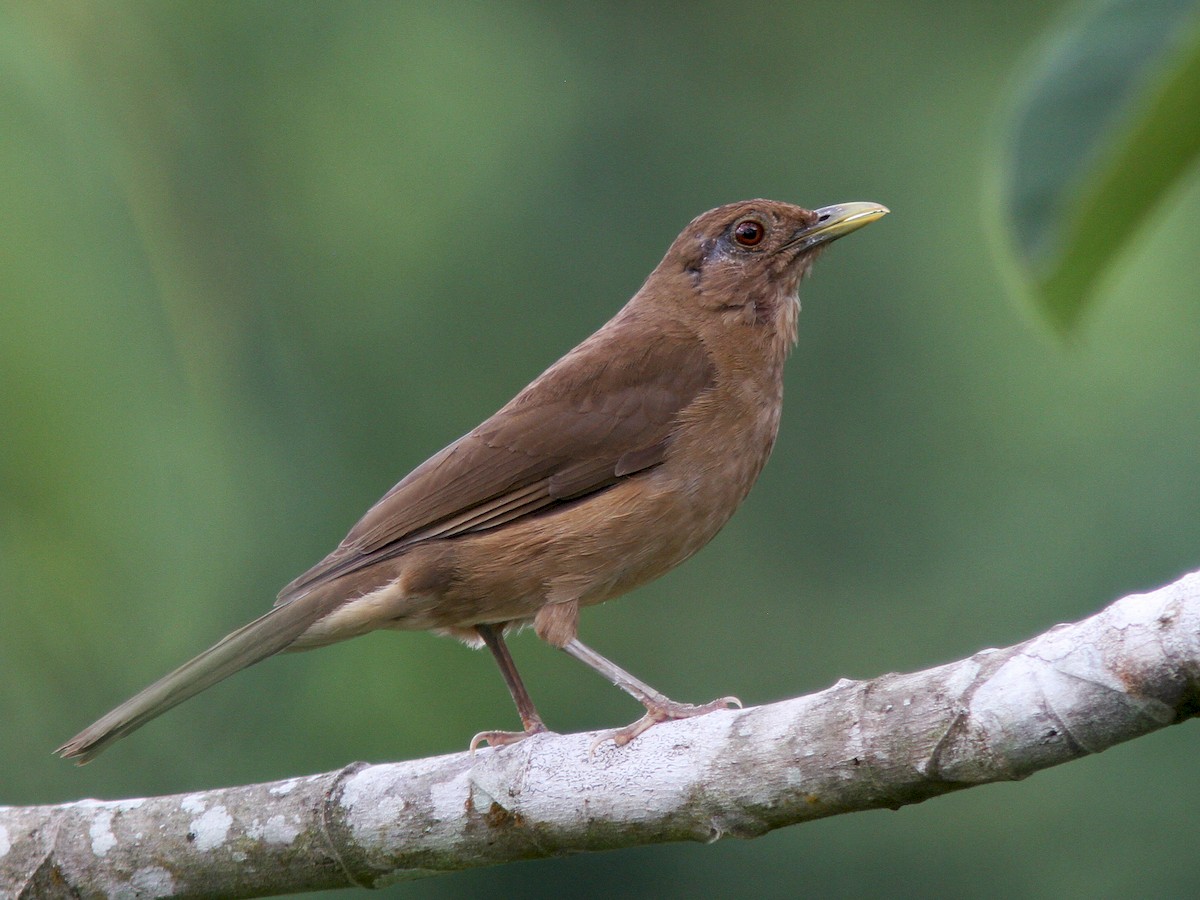
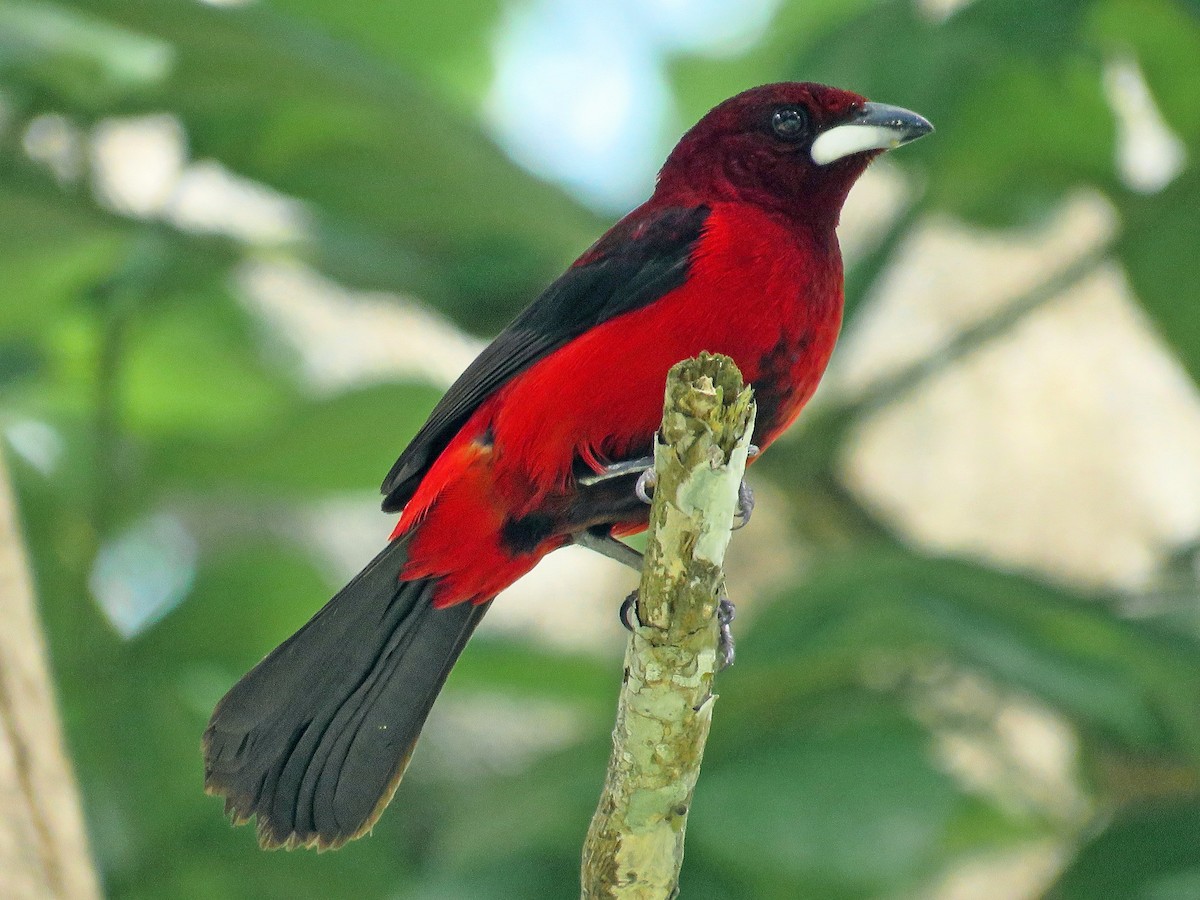
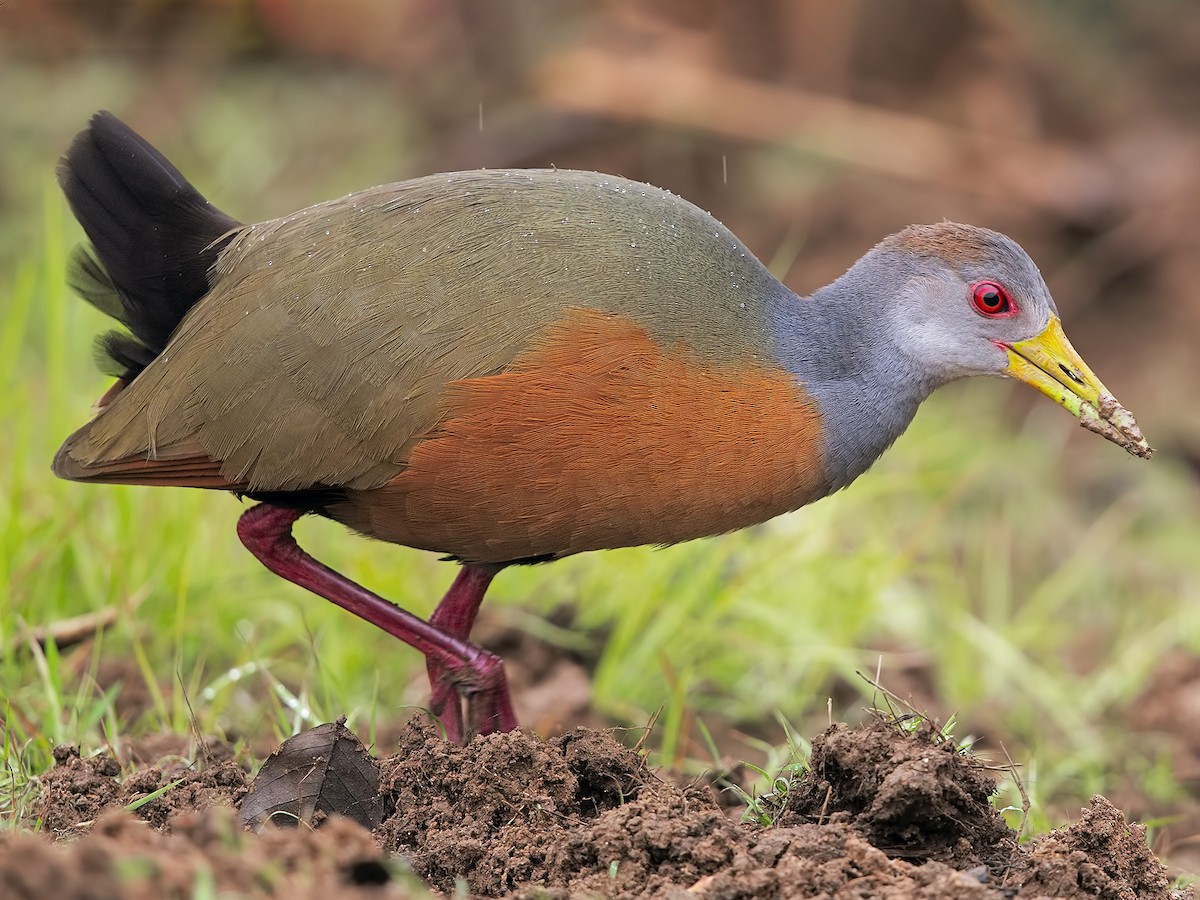
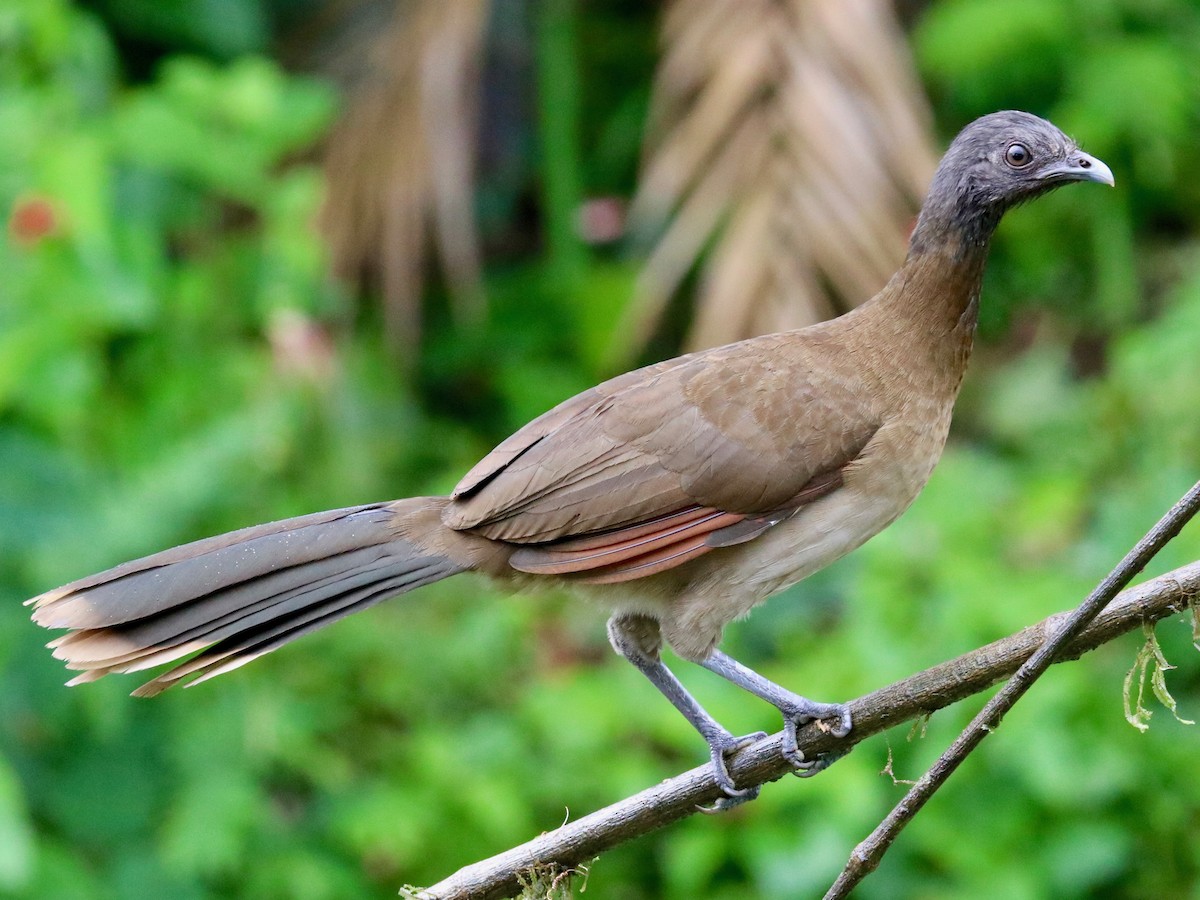
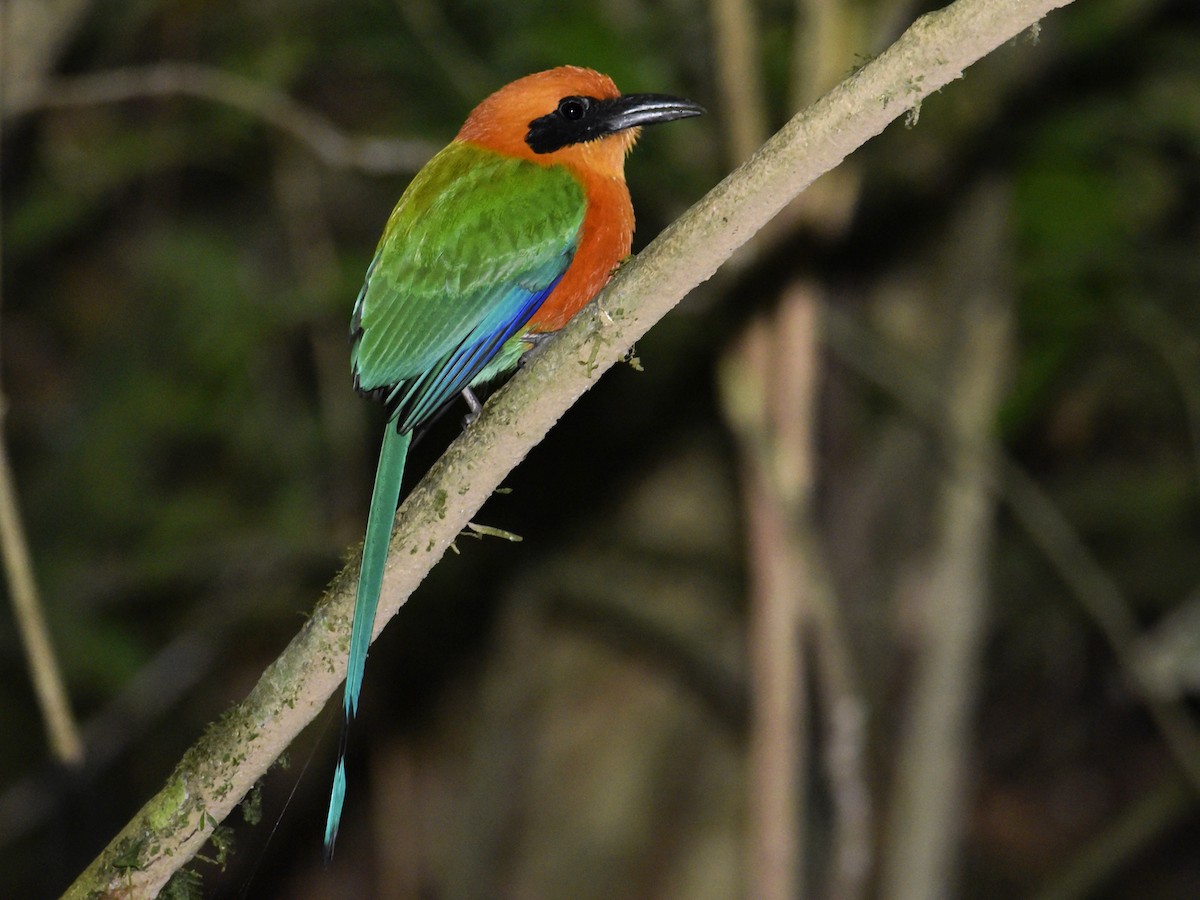
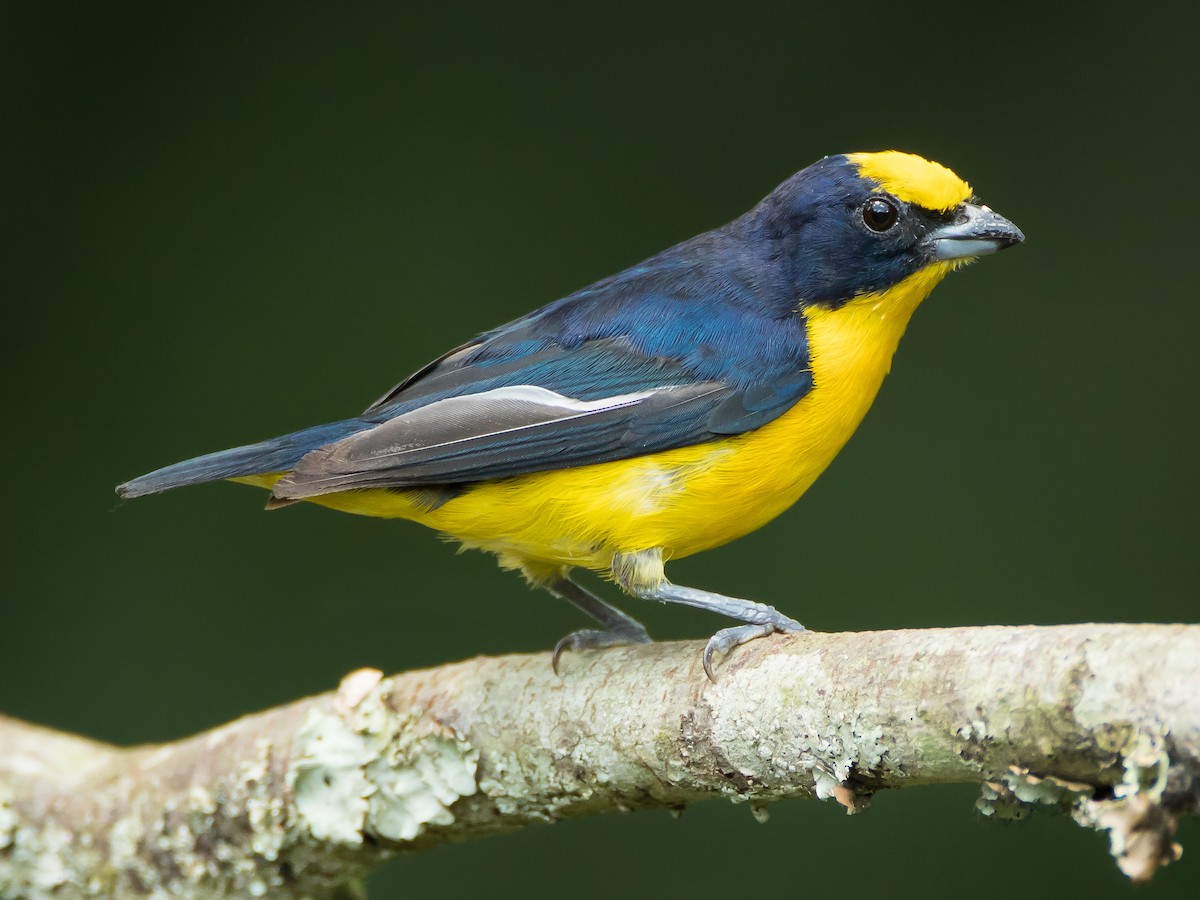
Clay-colored Thrush by Larry Therrien/Macaulay Library; Crimson-backed Tanager by Rolando Jordan/Macaulay Library; Gray-cowled Wood-Rail by Marco Valentini/Macaulay ; Gray-headed Chachalaca by Robbin Mallett/Macaulay Library; Rufous Motmot by Daniel Irons/Macaulay Library; Library; Thick-billed Euphonia by Dorian Anderson/Macaulay Library
Methods
With the questions and study design solidified, we were ready for the next phase: using a new online feature to collect data from the cam in real time.
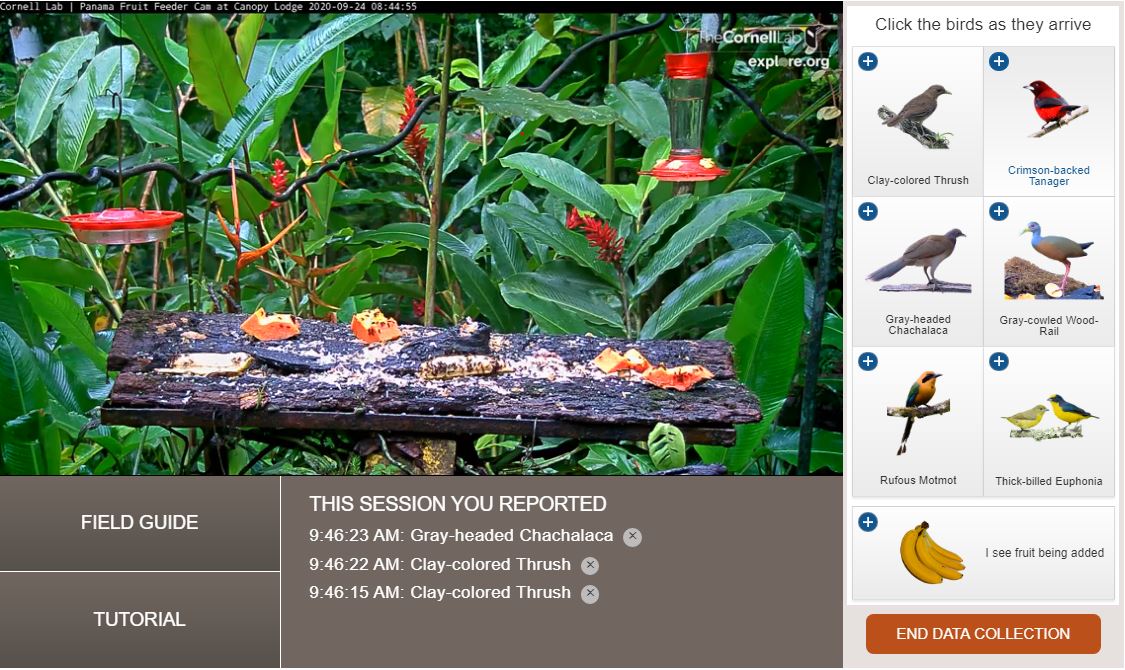
For the first time ever, we collected data in real time from one of the Cornell Lab’s online bird cams! Viewers were able to click every time they saw one of the six focal species arrive and click when they saw fruit being added to the feeder. We provided a short one-minute video and encouraged all data collectors to read a tutorial before getting started. Additionally, we had an online Field Guide available to aid viewers in species identification.
Sixty participants watched the live cam and made more than 11,000 observations during February 10–24. When we were not collecting data, we continued to connect with each other and converse on a Discussion Board. Based on those discussions and community requests, we improved the data-collection interface by adding a picture of the female Thick-billed Euphonia to its species button (this species is dimorphic, meaning that the male and female look different) and including more pictures in the Field Guide of easily confused species.
Once we finished collecting data, the researchers prepared the data for the exploration phase. First they needed to account for the fact that multiple people could have watched at the same time, for different periods of time, and at different times of day. Additionally, they needed to make sure to exclude the observations made when the camera was offline and pre-recorded highlight clips were playing. (When highlight clips played, the only indication that the footage was not live was a message at the bottom left corner, so many people still made observations.) As a first step, the researchers looked at the likelihood of each species arriving at the feeder. This was calculated as percentages indicating the chances for each species to be present in half-hour intervals throughout the day, or five-minute intervals since food was put out. The researchers calculated these percentages using data collected during February 10–24. More details about this method can be found here.
The researchers then used the data to generate interactive visualizations so that the community could visually explore the data together. This was especially exciting because we had never collected data live before and we were eager to see what we would learn about the birds’ arrival patterns at the feeder.
Four Bird Cams Lab community participants engaged in the online forums, asking questions and proposing ideas to explain the patterns they saw in the visualizations. We also hosted a live webinar, “Panama Live: Uncovering the Lives of Tropical Feeder Birds,” (watch archived recording here) to highlight our favorite video clips of the six focal species, learn about their natural history, and discuss the patterns seen in the visualizations. More than 100 people attended live and an estimated 1,200 people watched the recording afterward. During the live event we had an engaging discussion with attendees, who asked questions about the data and proposed new ideas for why we were seeing certain patterns.
Preliminary Results
Sampling effort
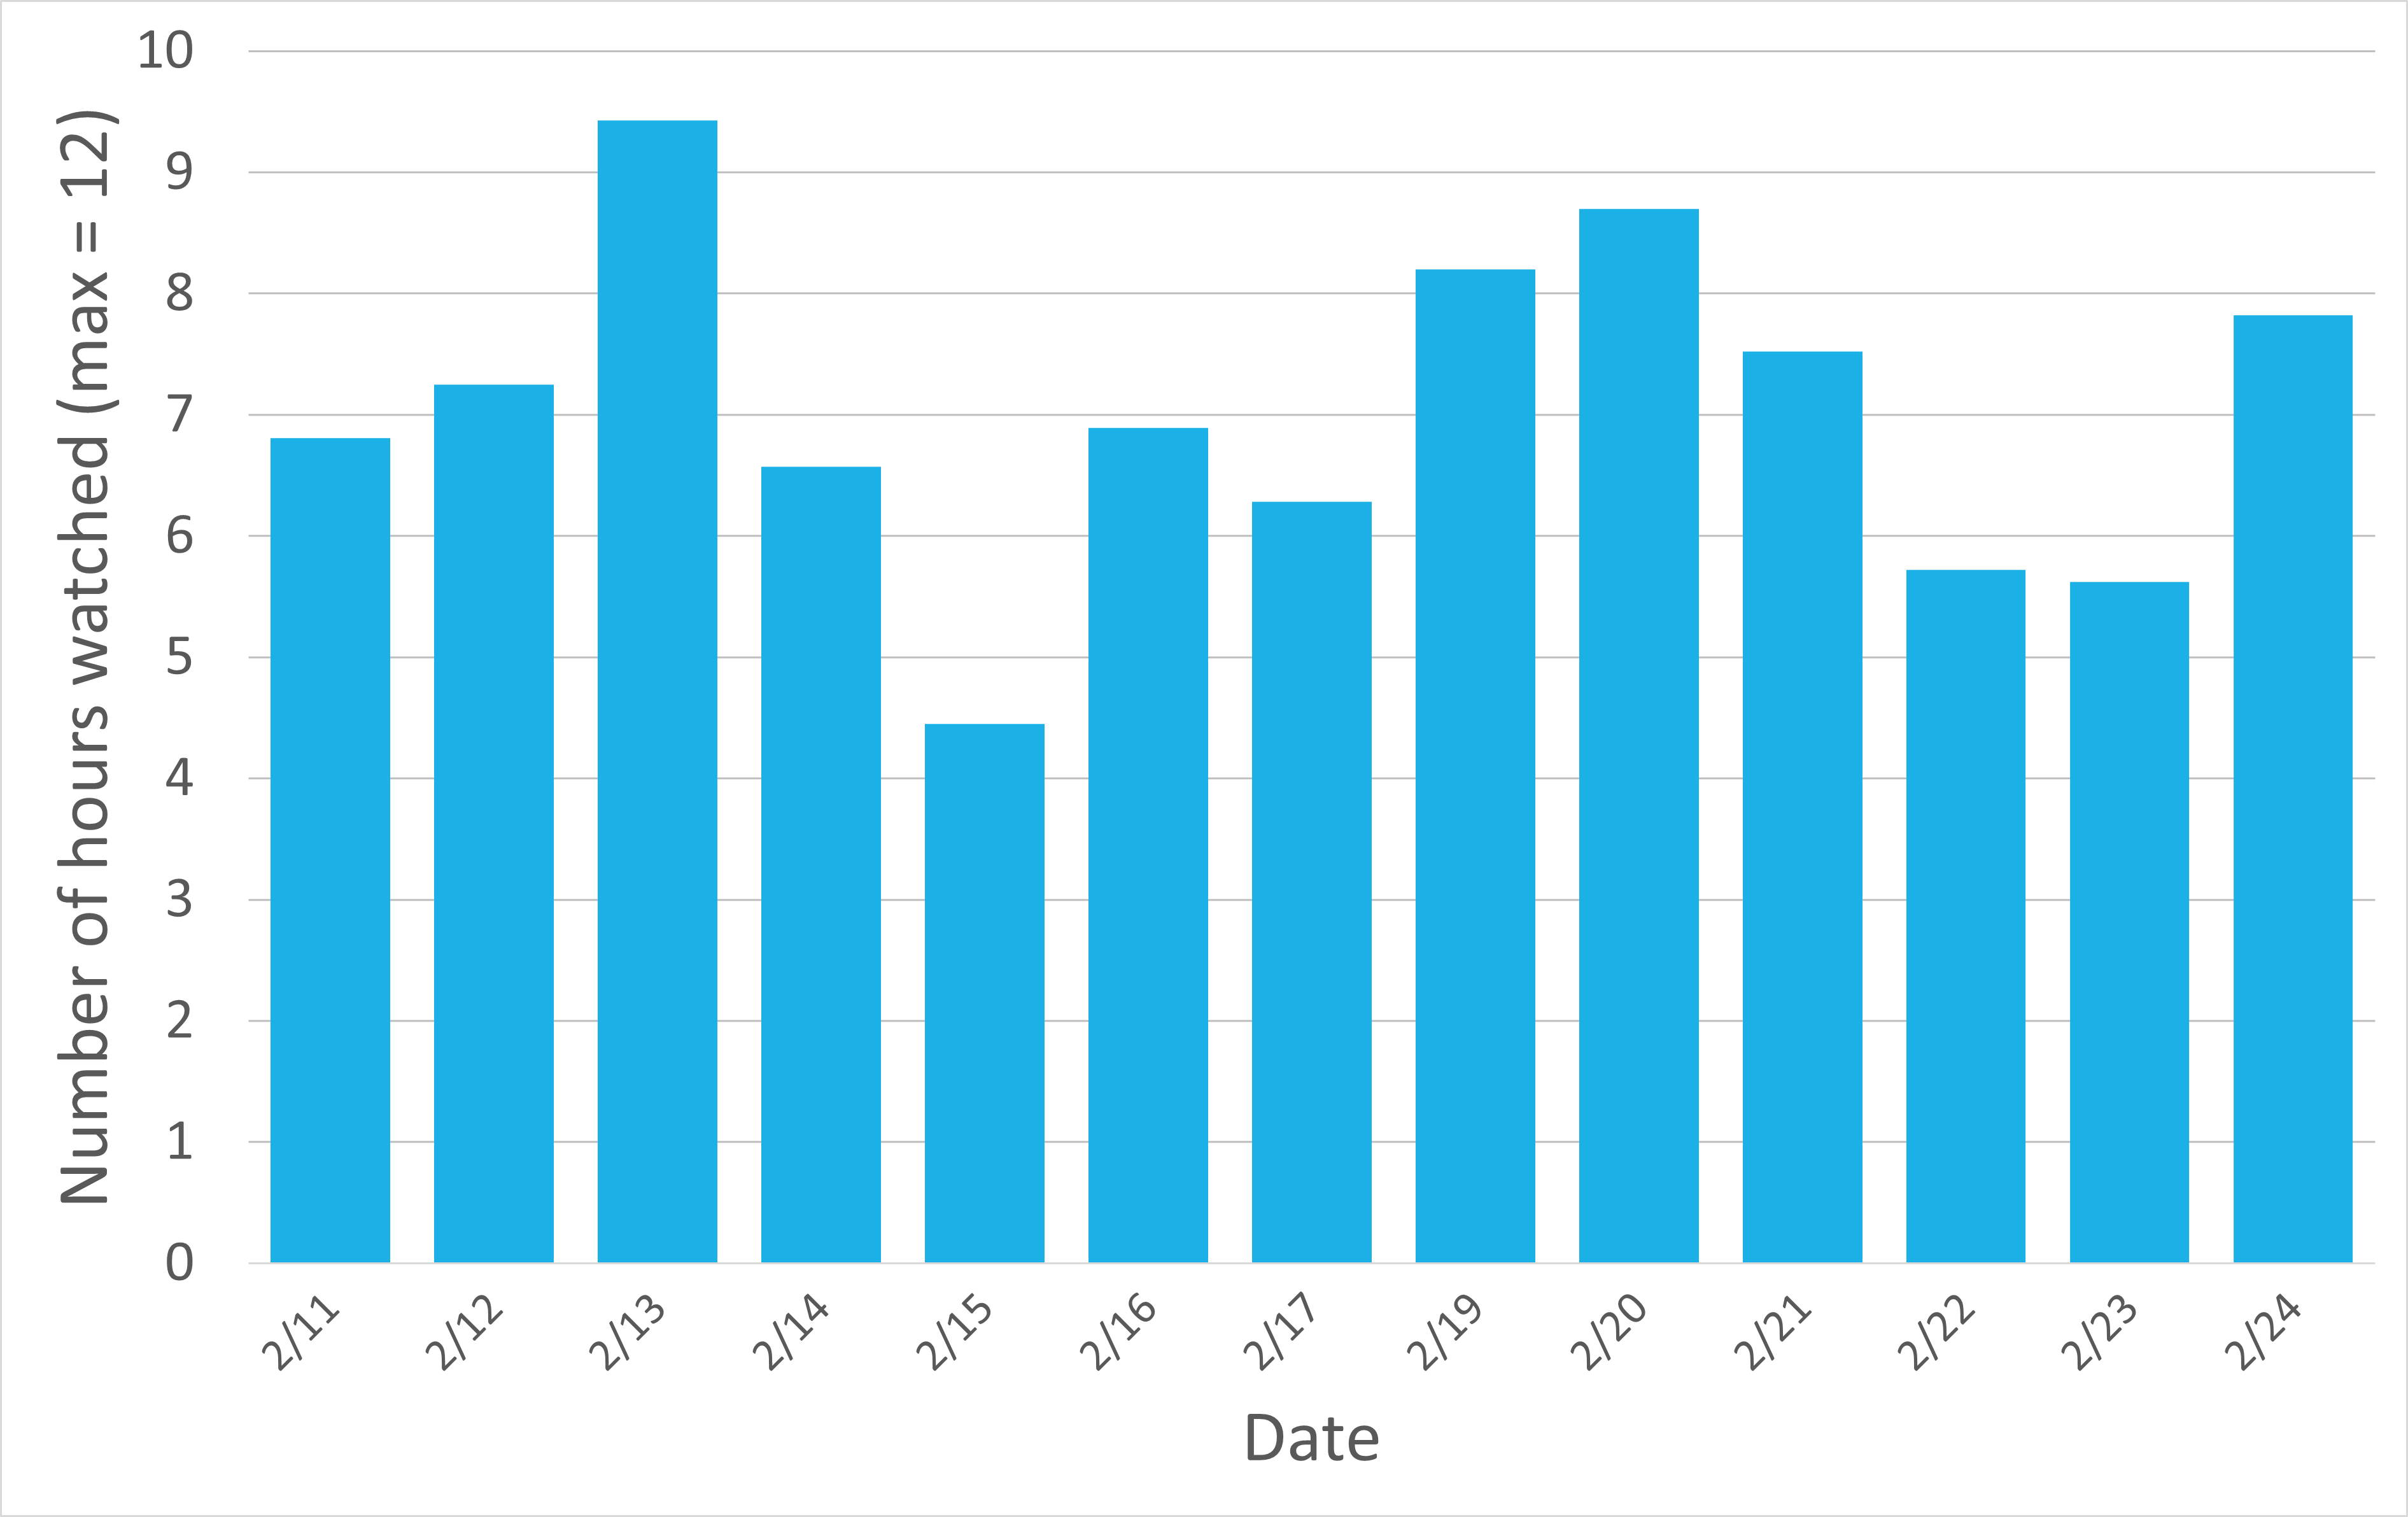
During the live webinar discussion, participants asked for more information about the “sampling effort.” For this investigation, we considered the sampling effort to be the amount of time at least one participant was watching and collecting data on the cam. Understanding the sampling effort is important to interpret the biological data. For example, the number of daylight hours watched by at least one participant varied day to day (Figure 4), and if the percentage chance of arrival for a species was lower on February 11 compared to February 13, it could be due to either bird behavior or due to less sampling effort.
The Number Of Hours Watched By Participants Varied By Day
Research Question #1: When do focal species arrive at the feeder?
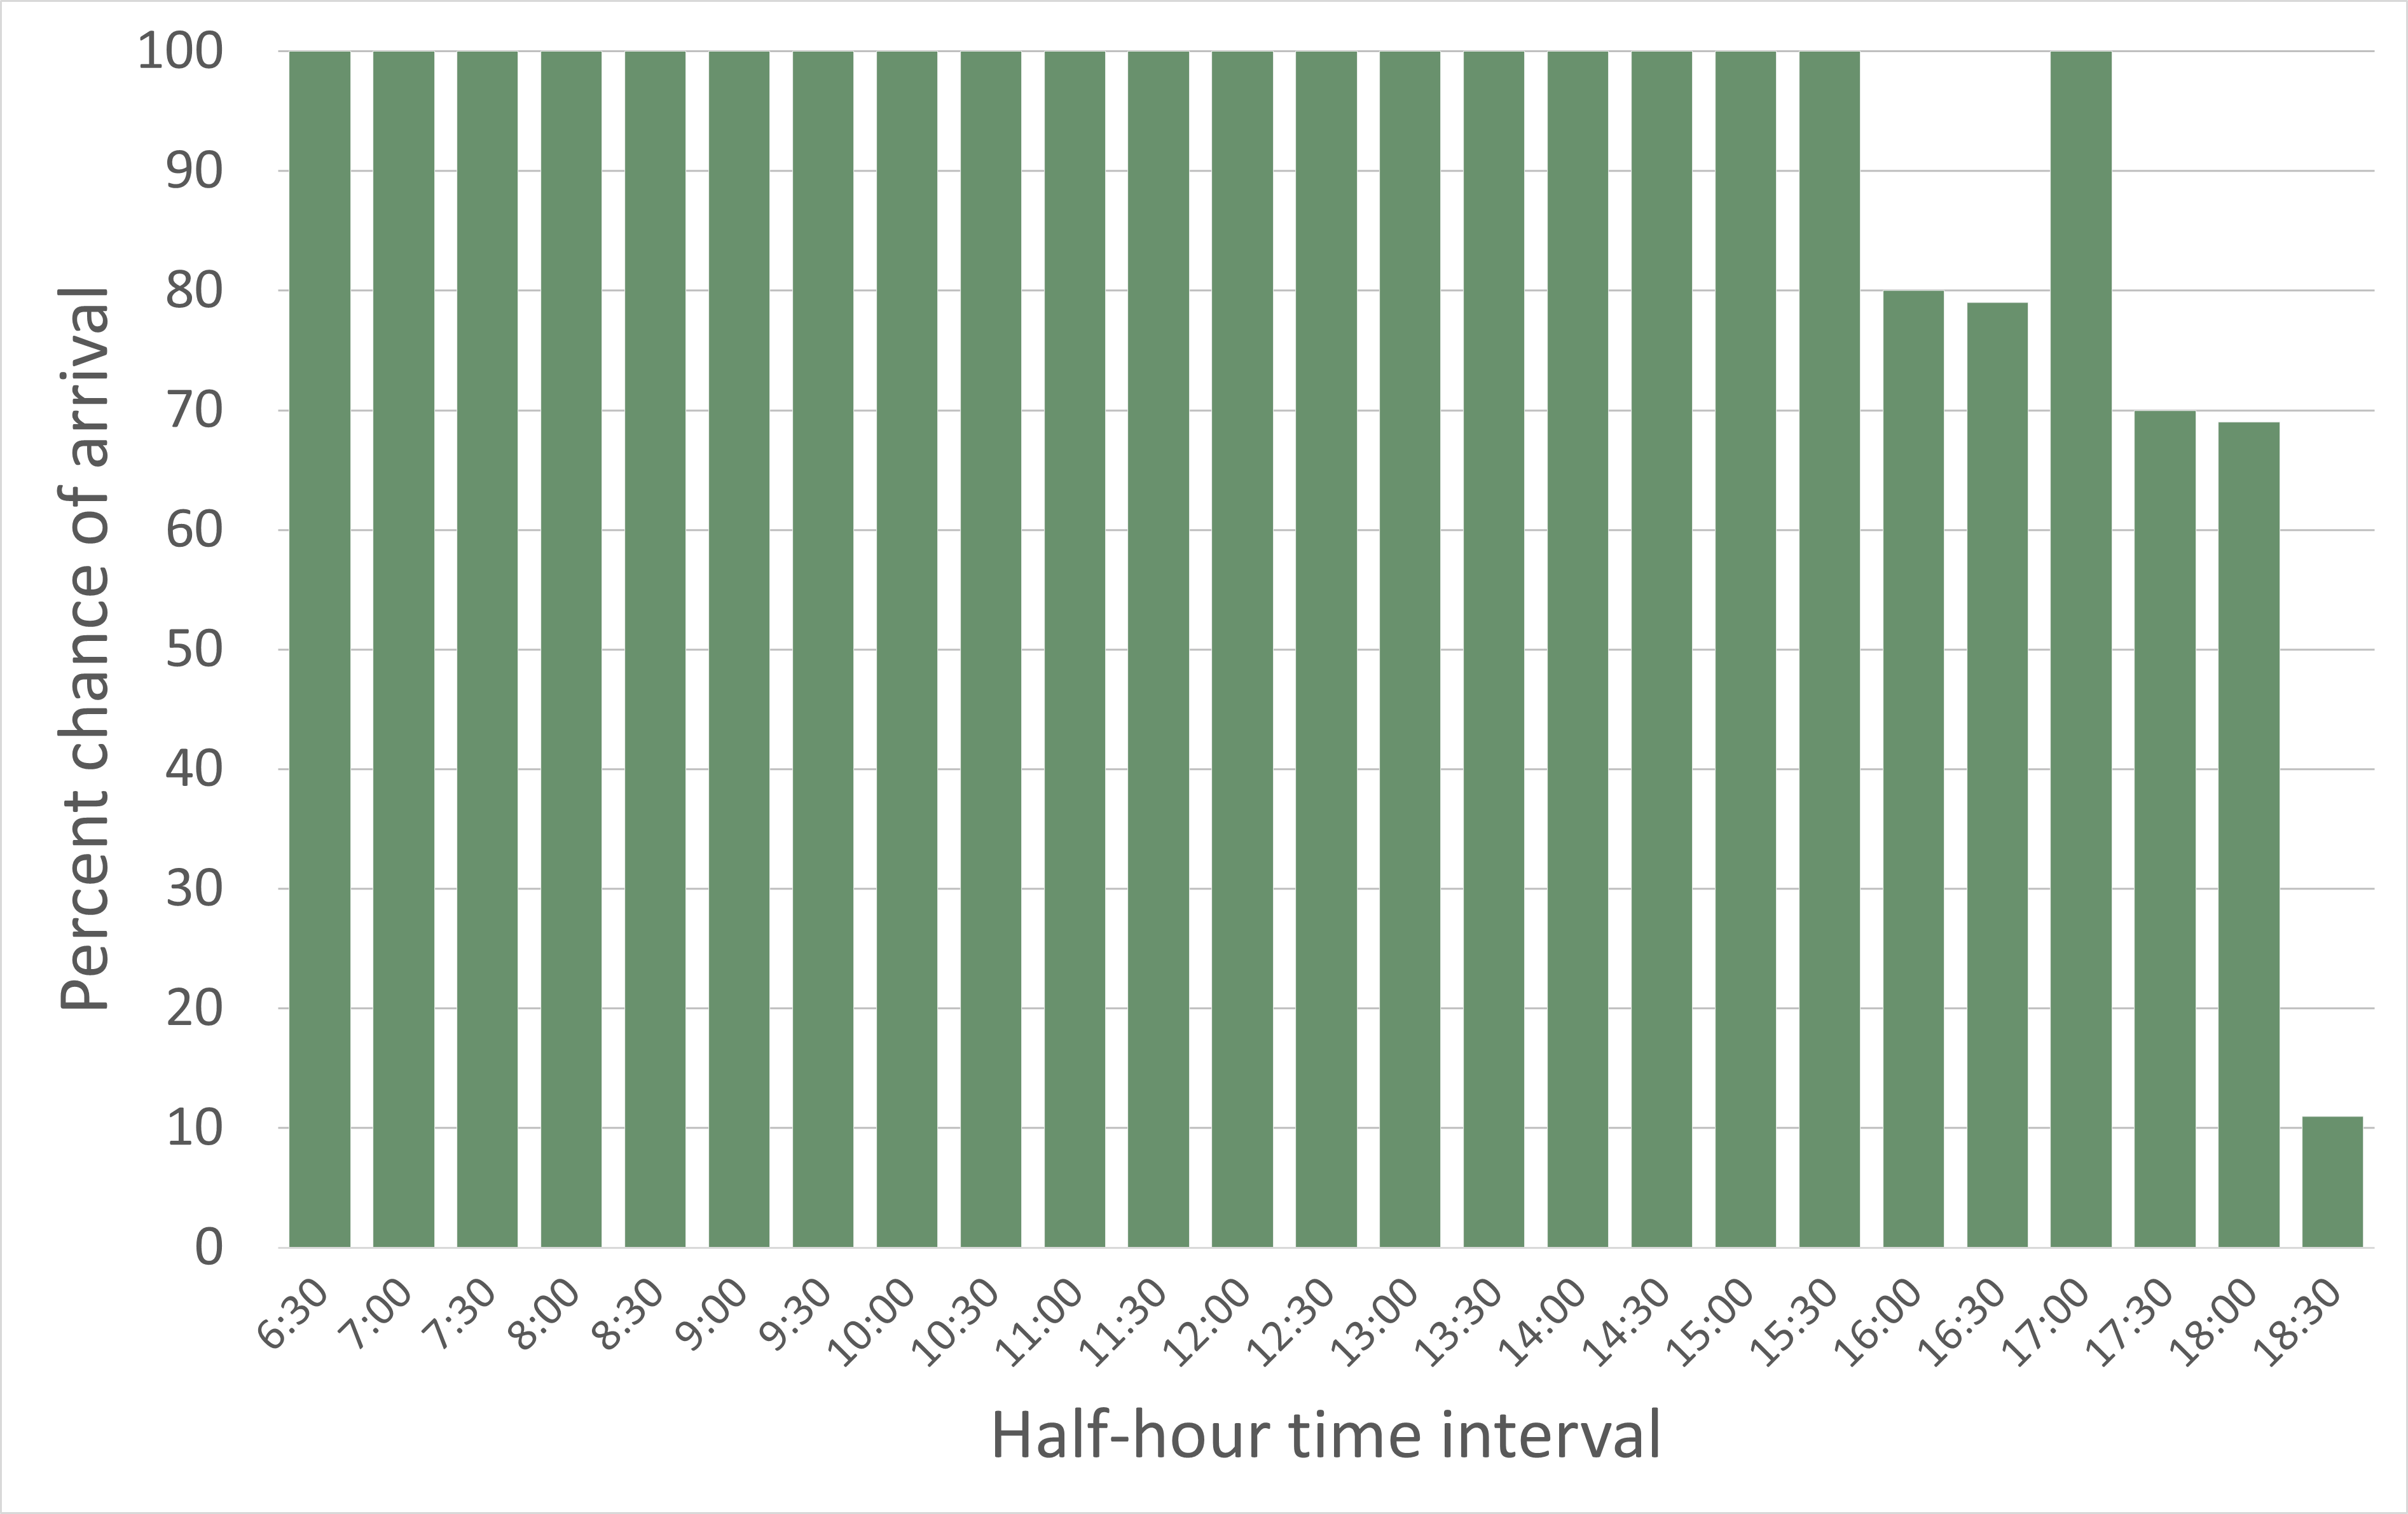
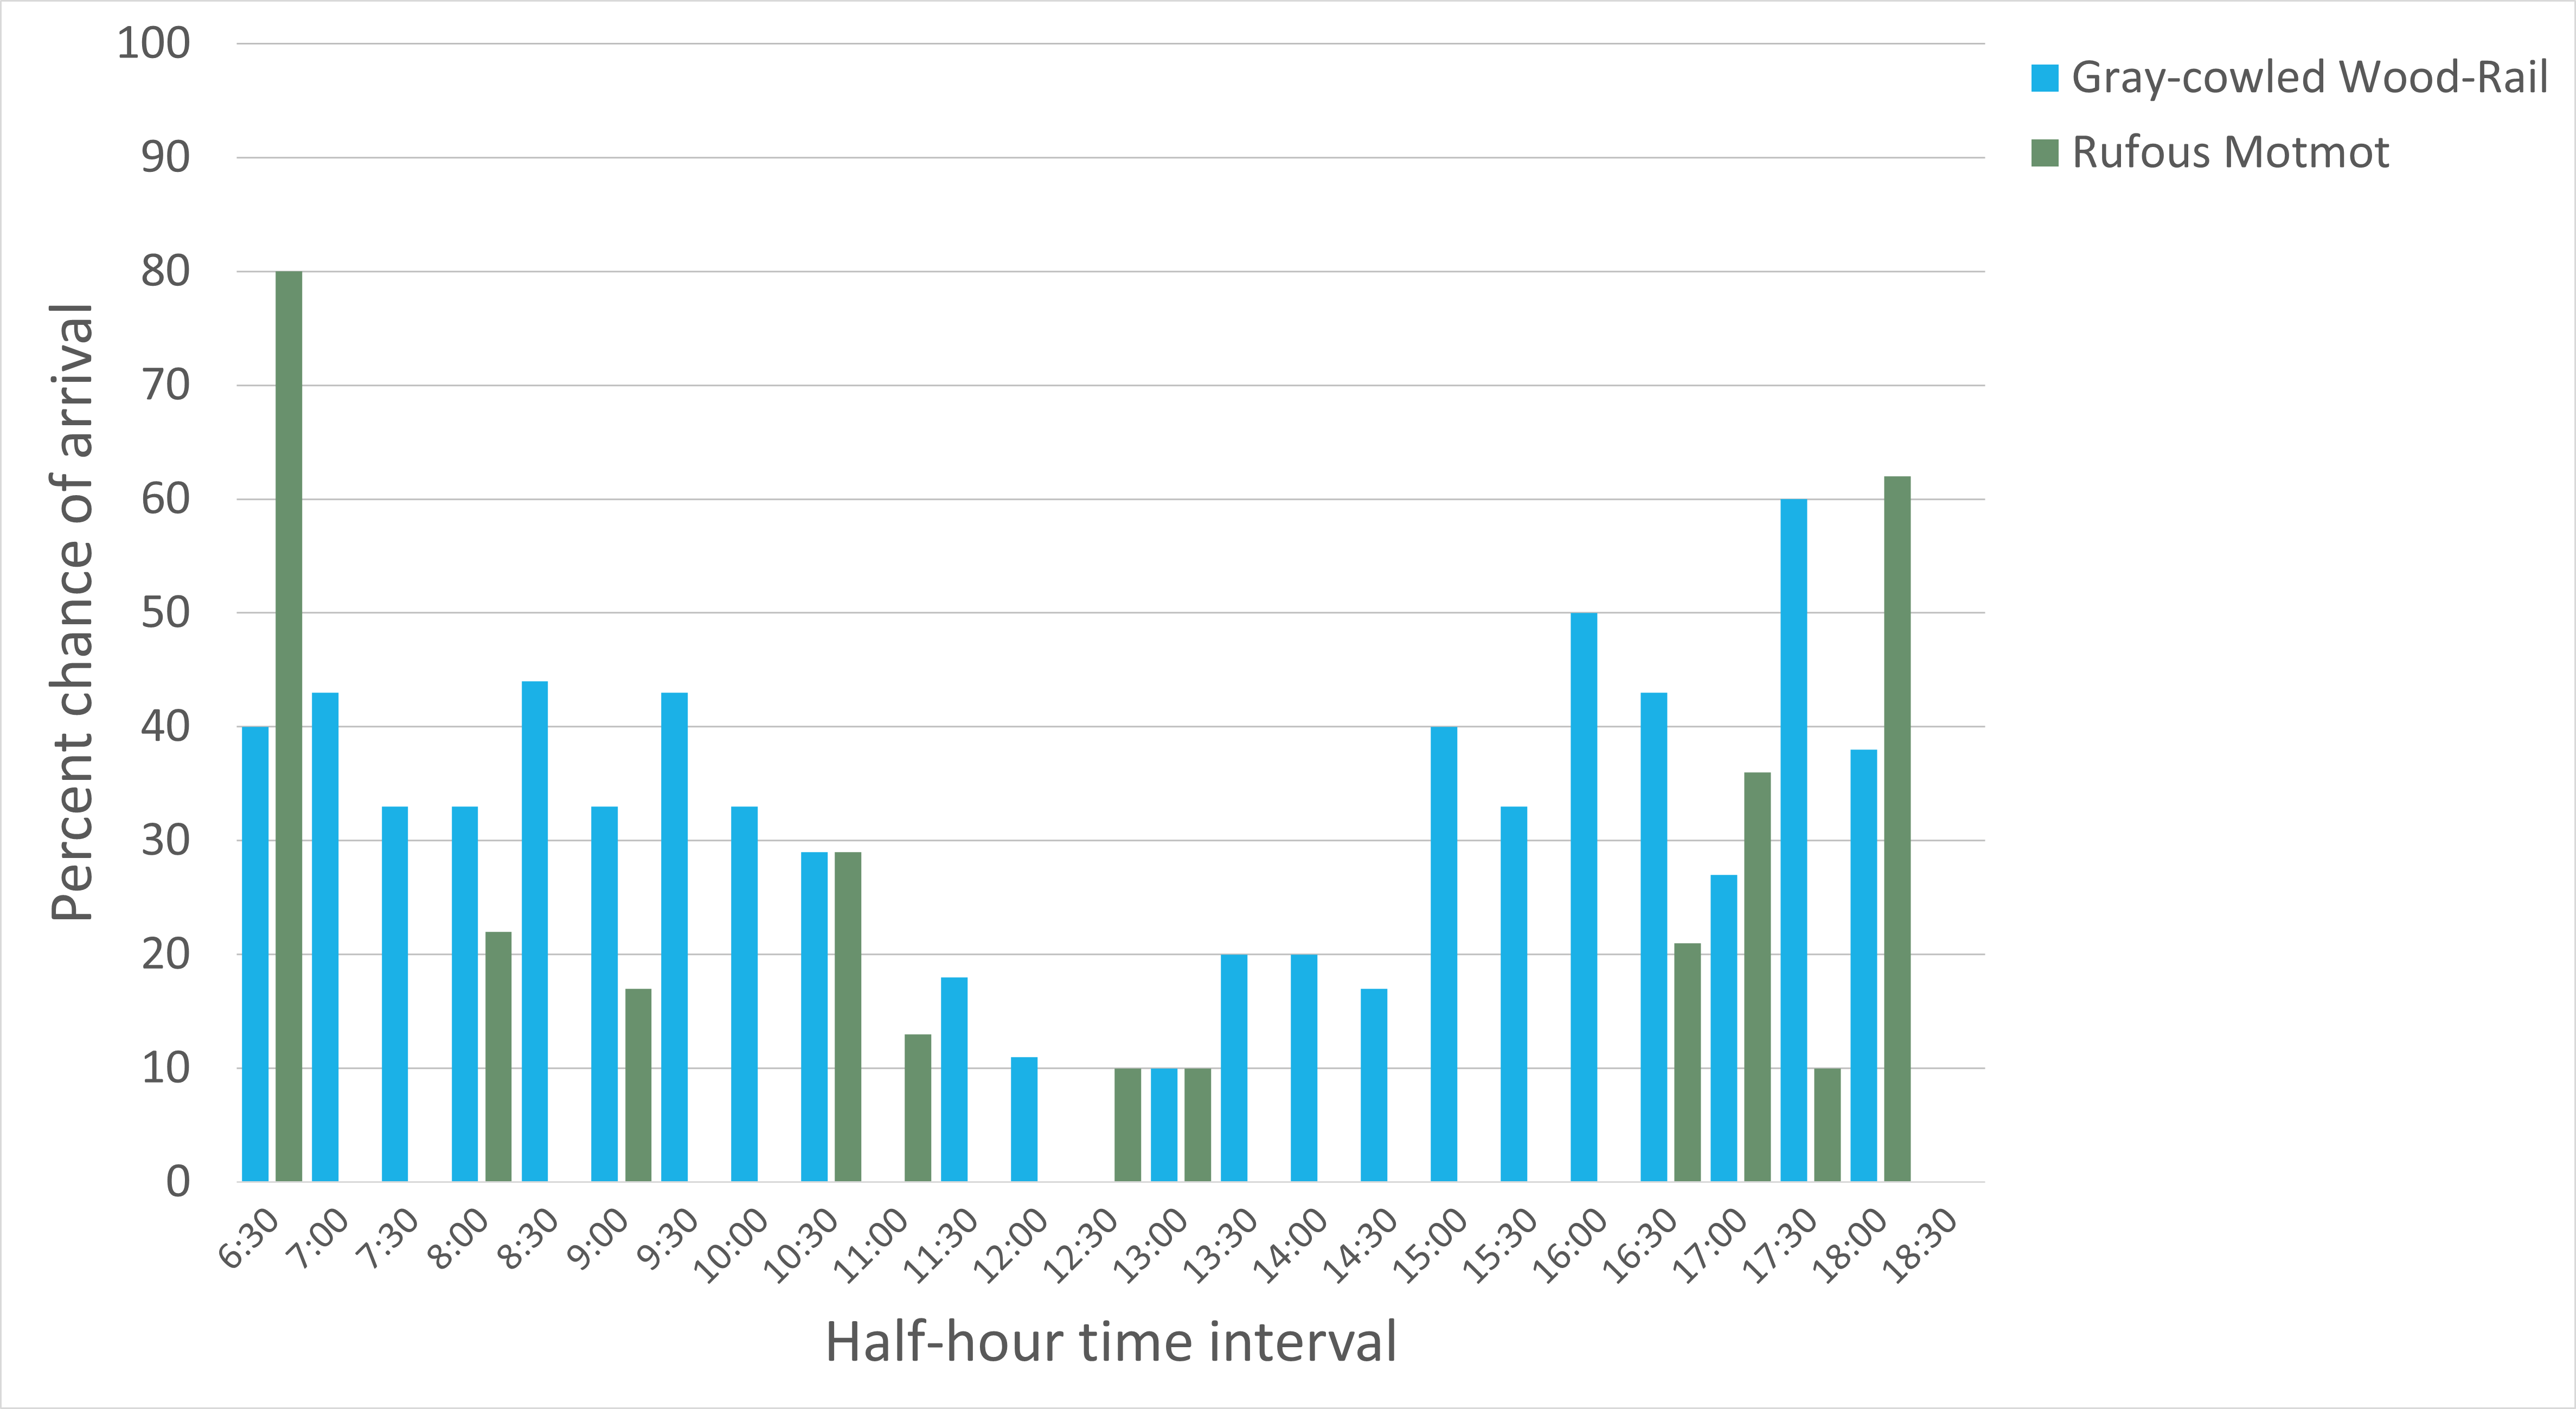
Overall, we learned that the different species varied considerably in their feeder arrival times. For example, participants recorded the Clay-colored Thrush at the feeder throughout the whole day, but arrivals declined after 16:00 (Figure 5). In contrast, the data showed that the Gray-cowled Wood-Rail and the Rufous Motmot were more likely to be at the feeder in the morning or evening, rather than midday (Figure 6). Participant Kaliopi Nikitas wondered if Gray-cowled Wood-Rails and Rufous Motmots may be influenced by the temperature and attempt to avoid the midday heat as it may be more energetically expensive to forage then.
Clay-colored Thrushes Were At The Feeder All Day
Two Species Were More Likely To Visit The Feeder In The Morning Or Evening
Research Question #2: Is there variability? How does this vary from day to day?
We addressed this question by looking at the percentage chance that a species would arrive during one of the half-hour intervals from 6:30 A.M. to 6:30 P.M. each day. Again, we saw variation from species to species. One of the interesting preliminary findings was that the percentage chance for Crimson-backed Tanagers and Thick-billed Euphonias to arrive at the feeder seemed to increase from February 11 to 24 (Figure 7). Additionally, a participant in the forums pointed out that there was no day in particular in which all species were more or less likely to be there, suggesting that other confounding factors like weather potentially played a minor role in the arrival of species.
Two Species Were More Likely To Visit The Feeder At The End Of The Data Collection Period
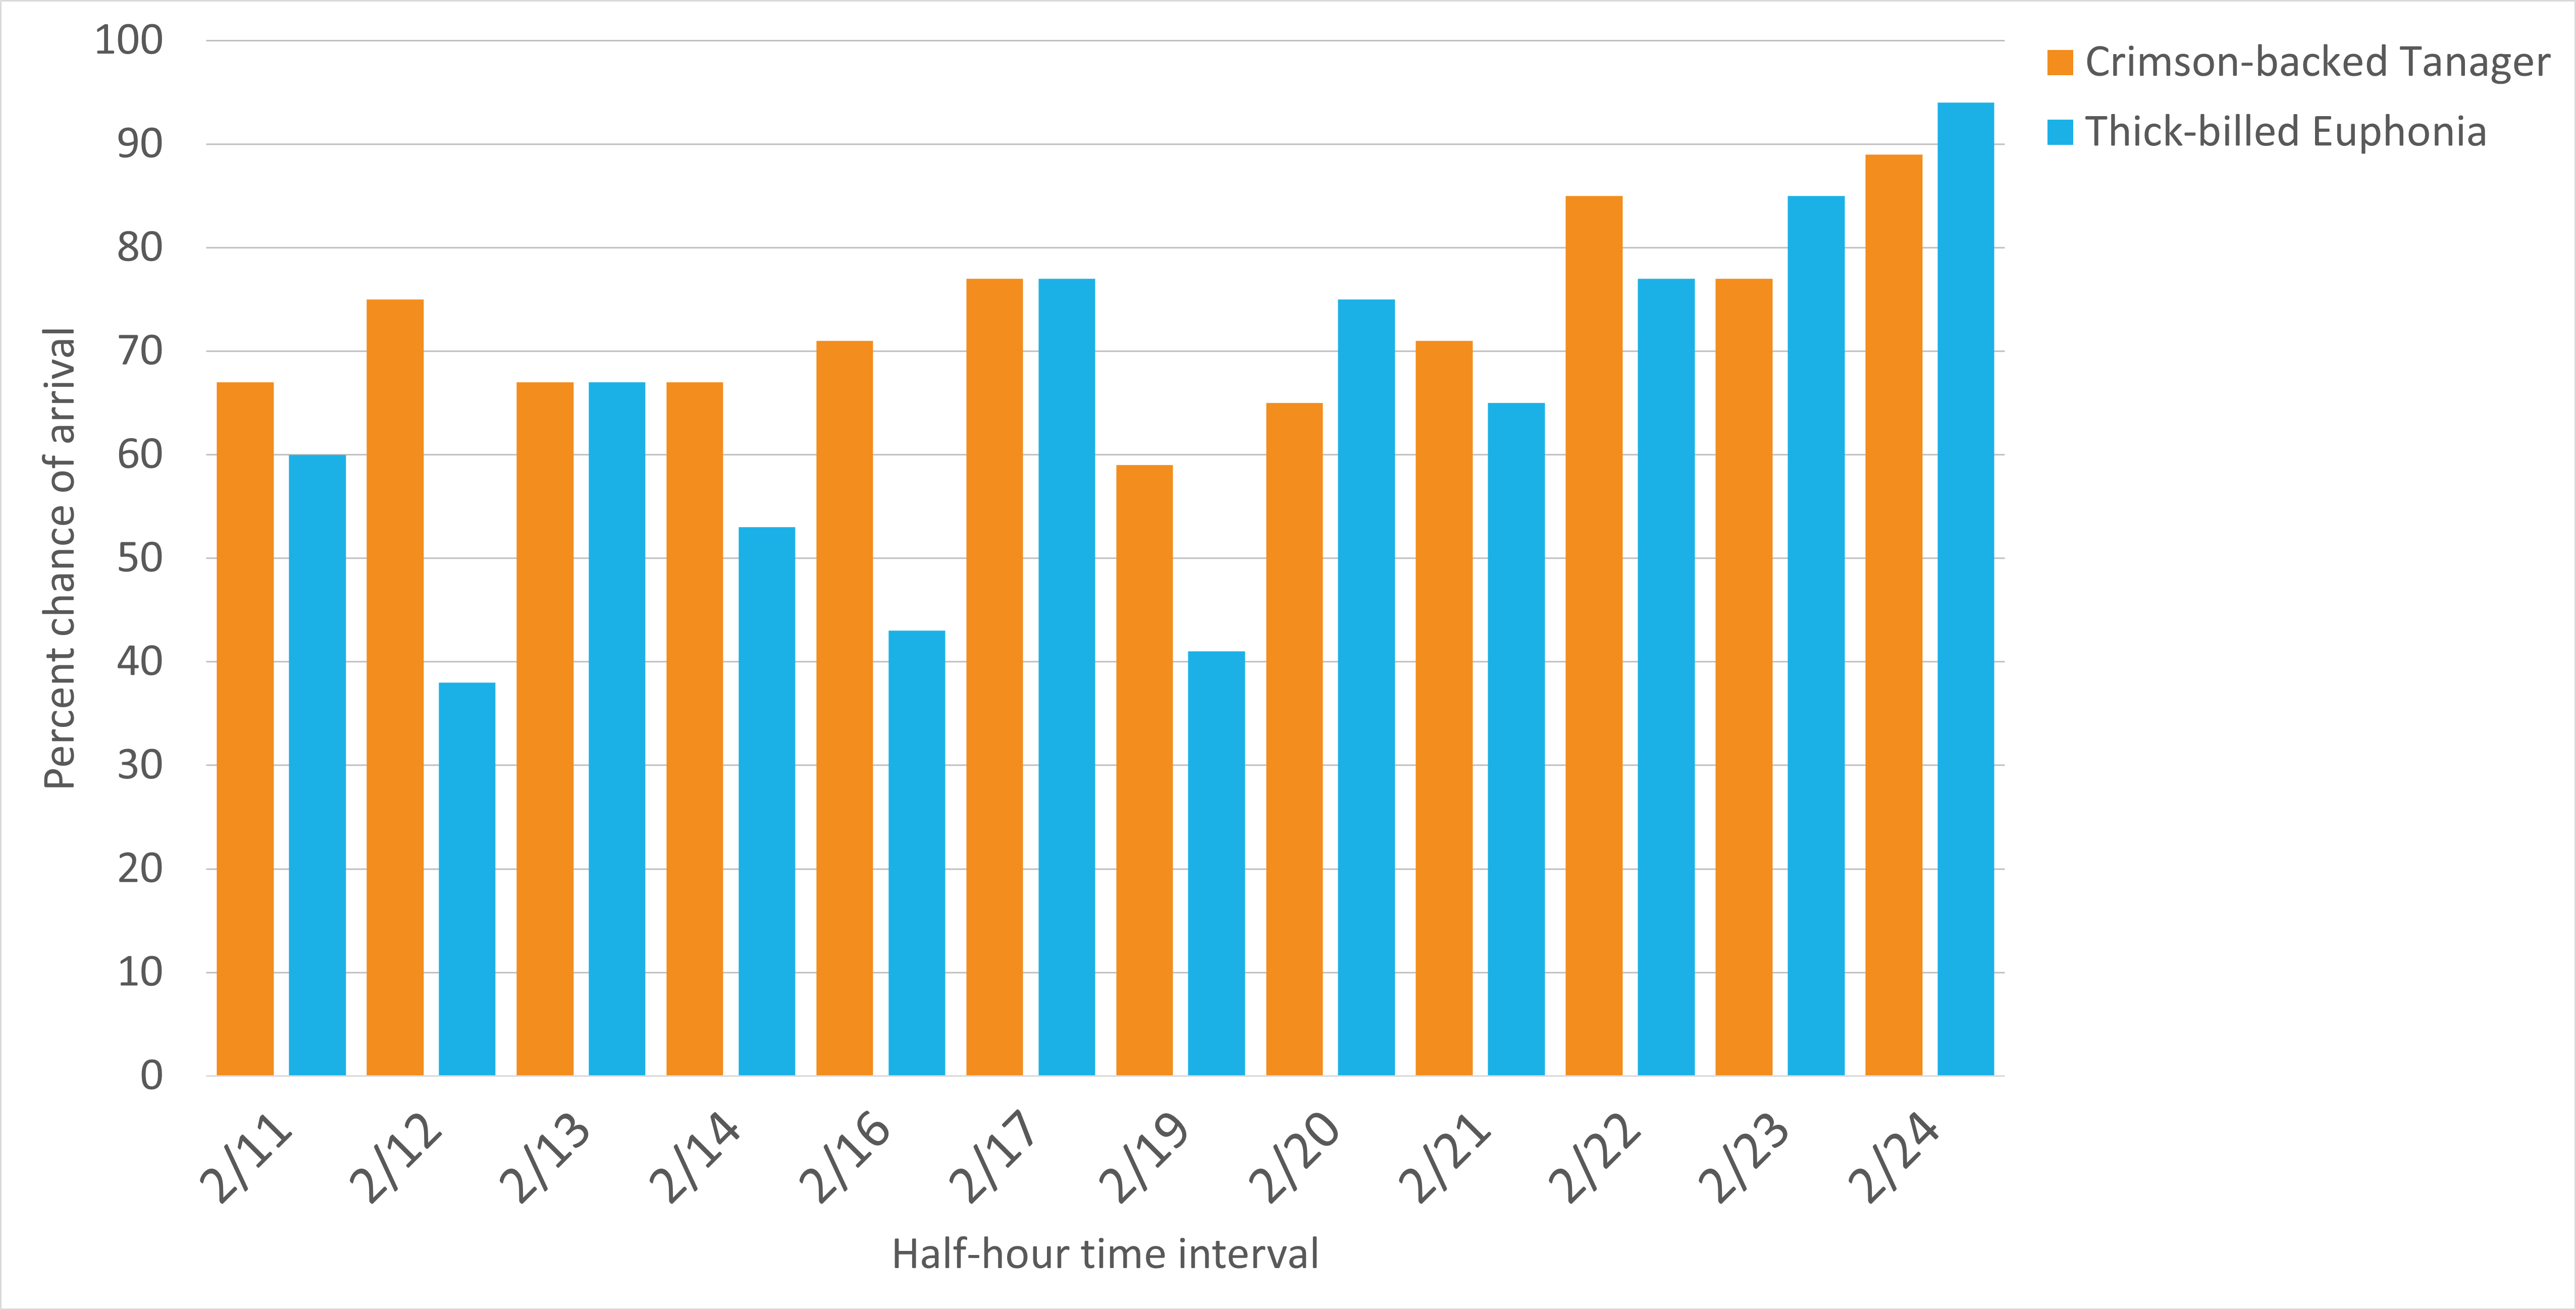
Figure 7. A bar chart in which the height of each bar represents the percentage chance that a species will arrive during one of the half-hour intervals during each day. The orange bars refer to the Crimson-backed Tanager and the blue bars refer to the Thick-billed Euphonia. Each day was split into 30-minute intervals from 6:30 A.M. to 6:30 P.M. Two dates, 2/15 and 2/18, are not included because we did not have data for more than half the daylight hours .
Research Question #3: Does the timing of food affect when birds arrive at the feeder?
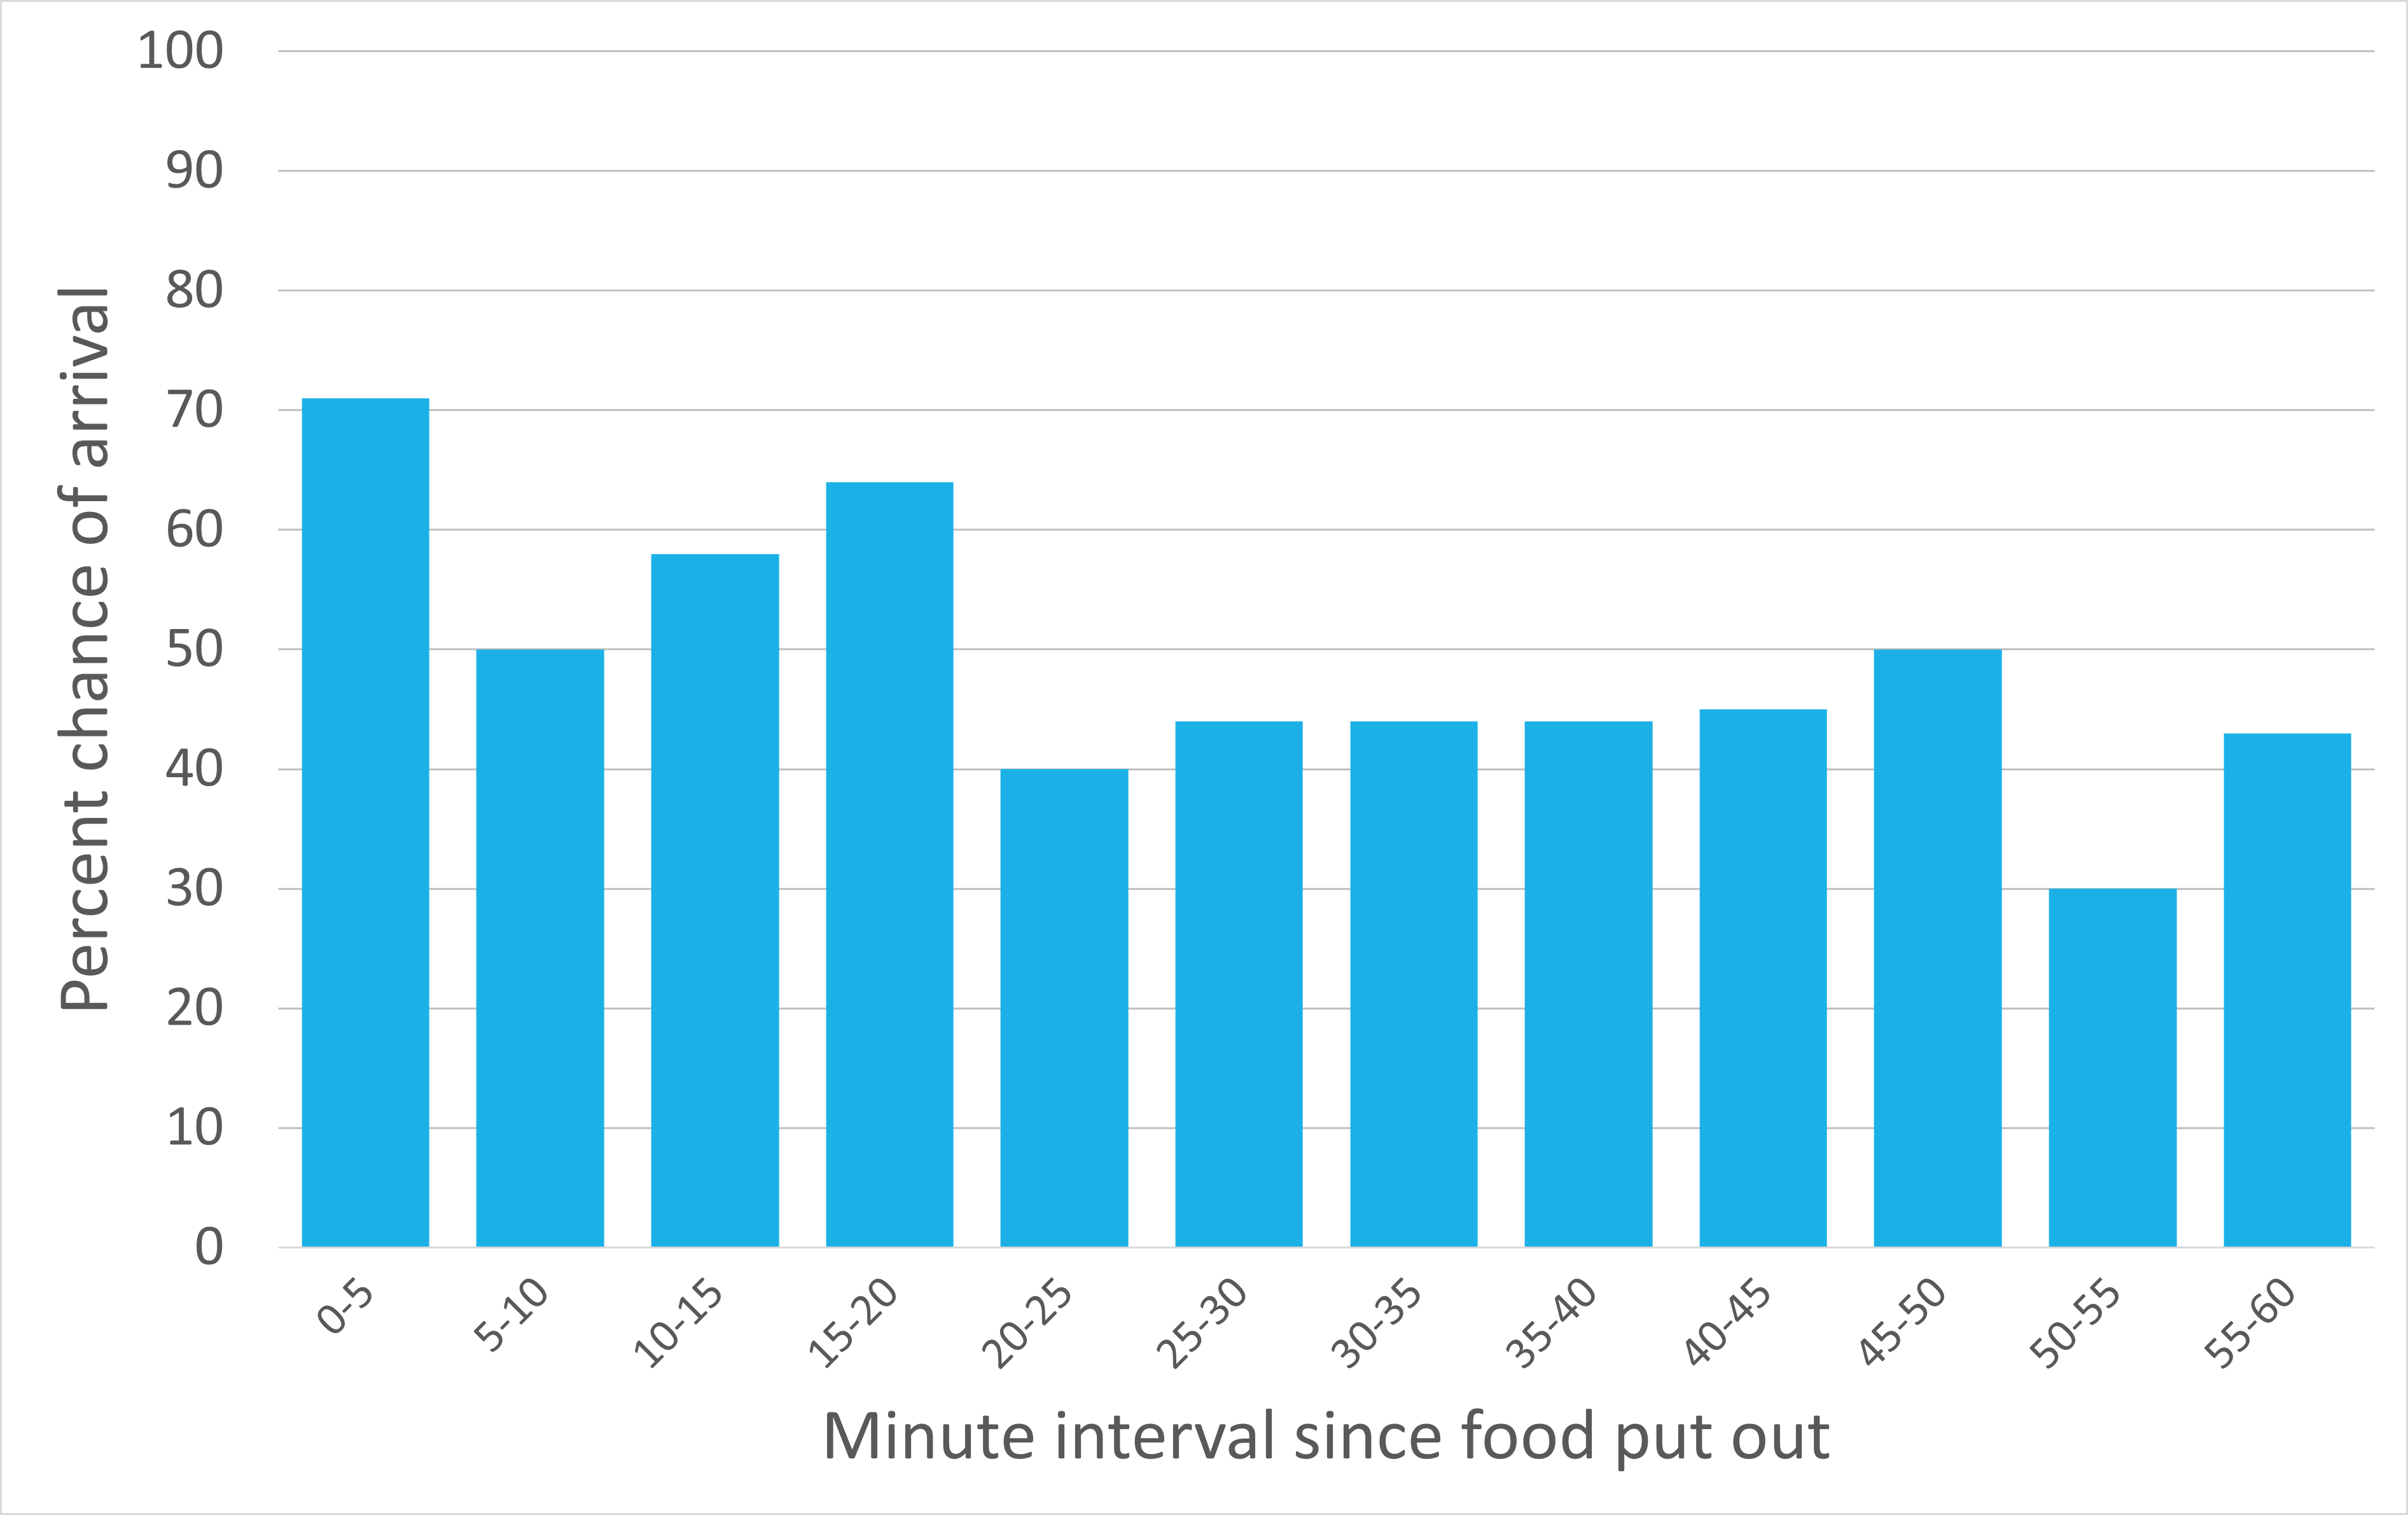
Because food was periodically added to the feeder about every two hours, the community wondered how the addition of food influenced the arrival of birds. The data suggested that differences among species continued to be the pattern. The presence of food appeared to only influence the arrival of the Clay-colored Thrushes in the evening, when they had a higher chance of arrival 0–20 minutes after food arrived compared to later (Figure 8).
In The Evening, Clay-colored Thrushes Were More Likely To Arrive Closer To When Food Is Replenished
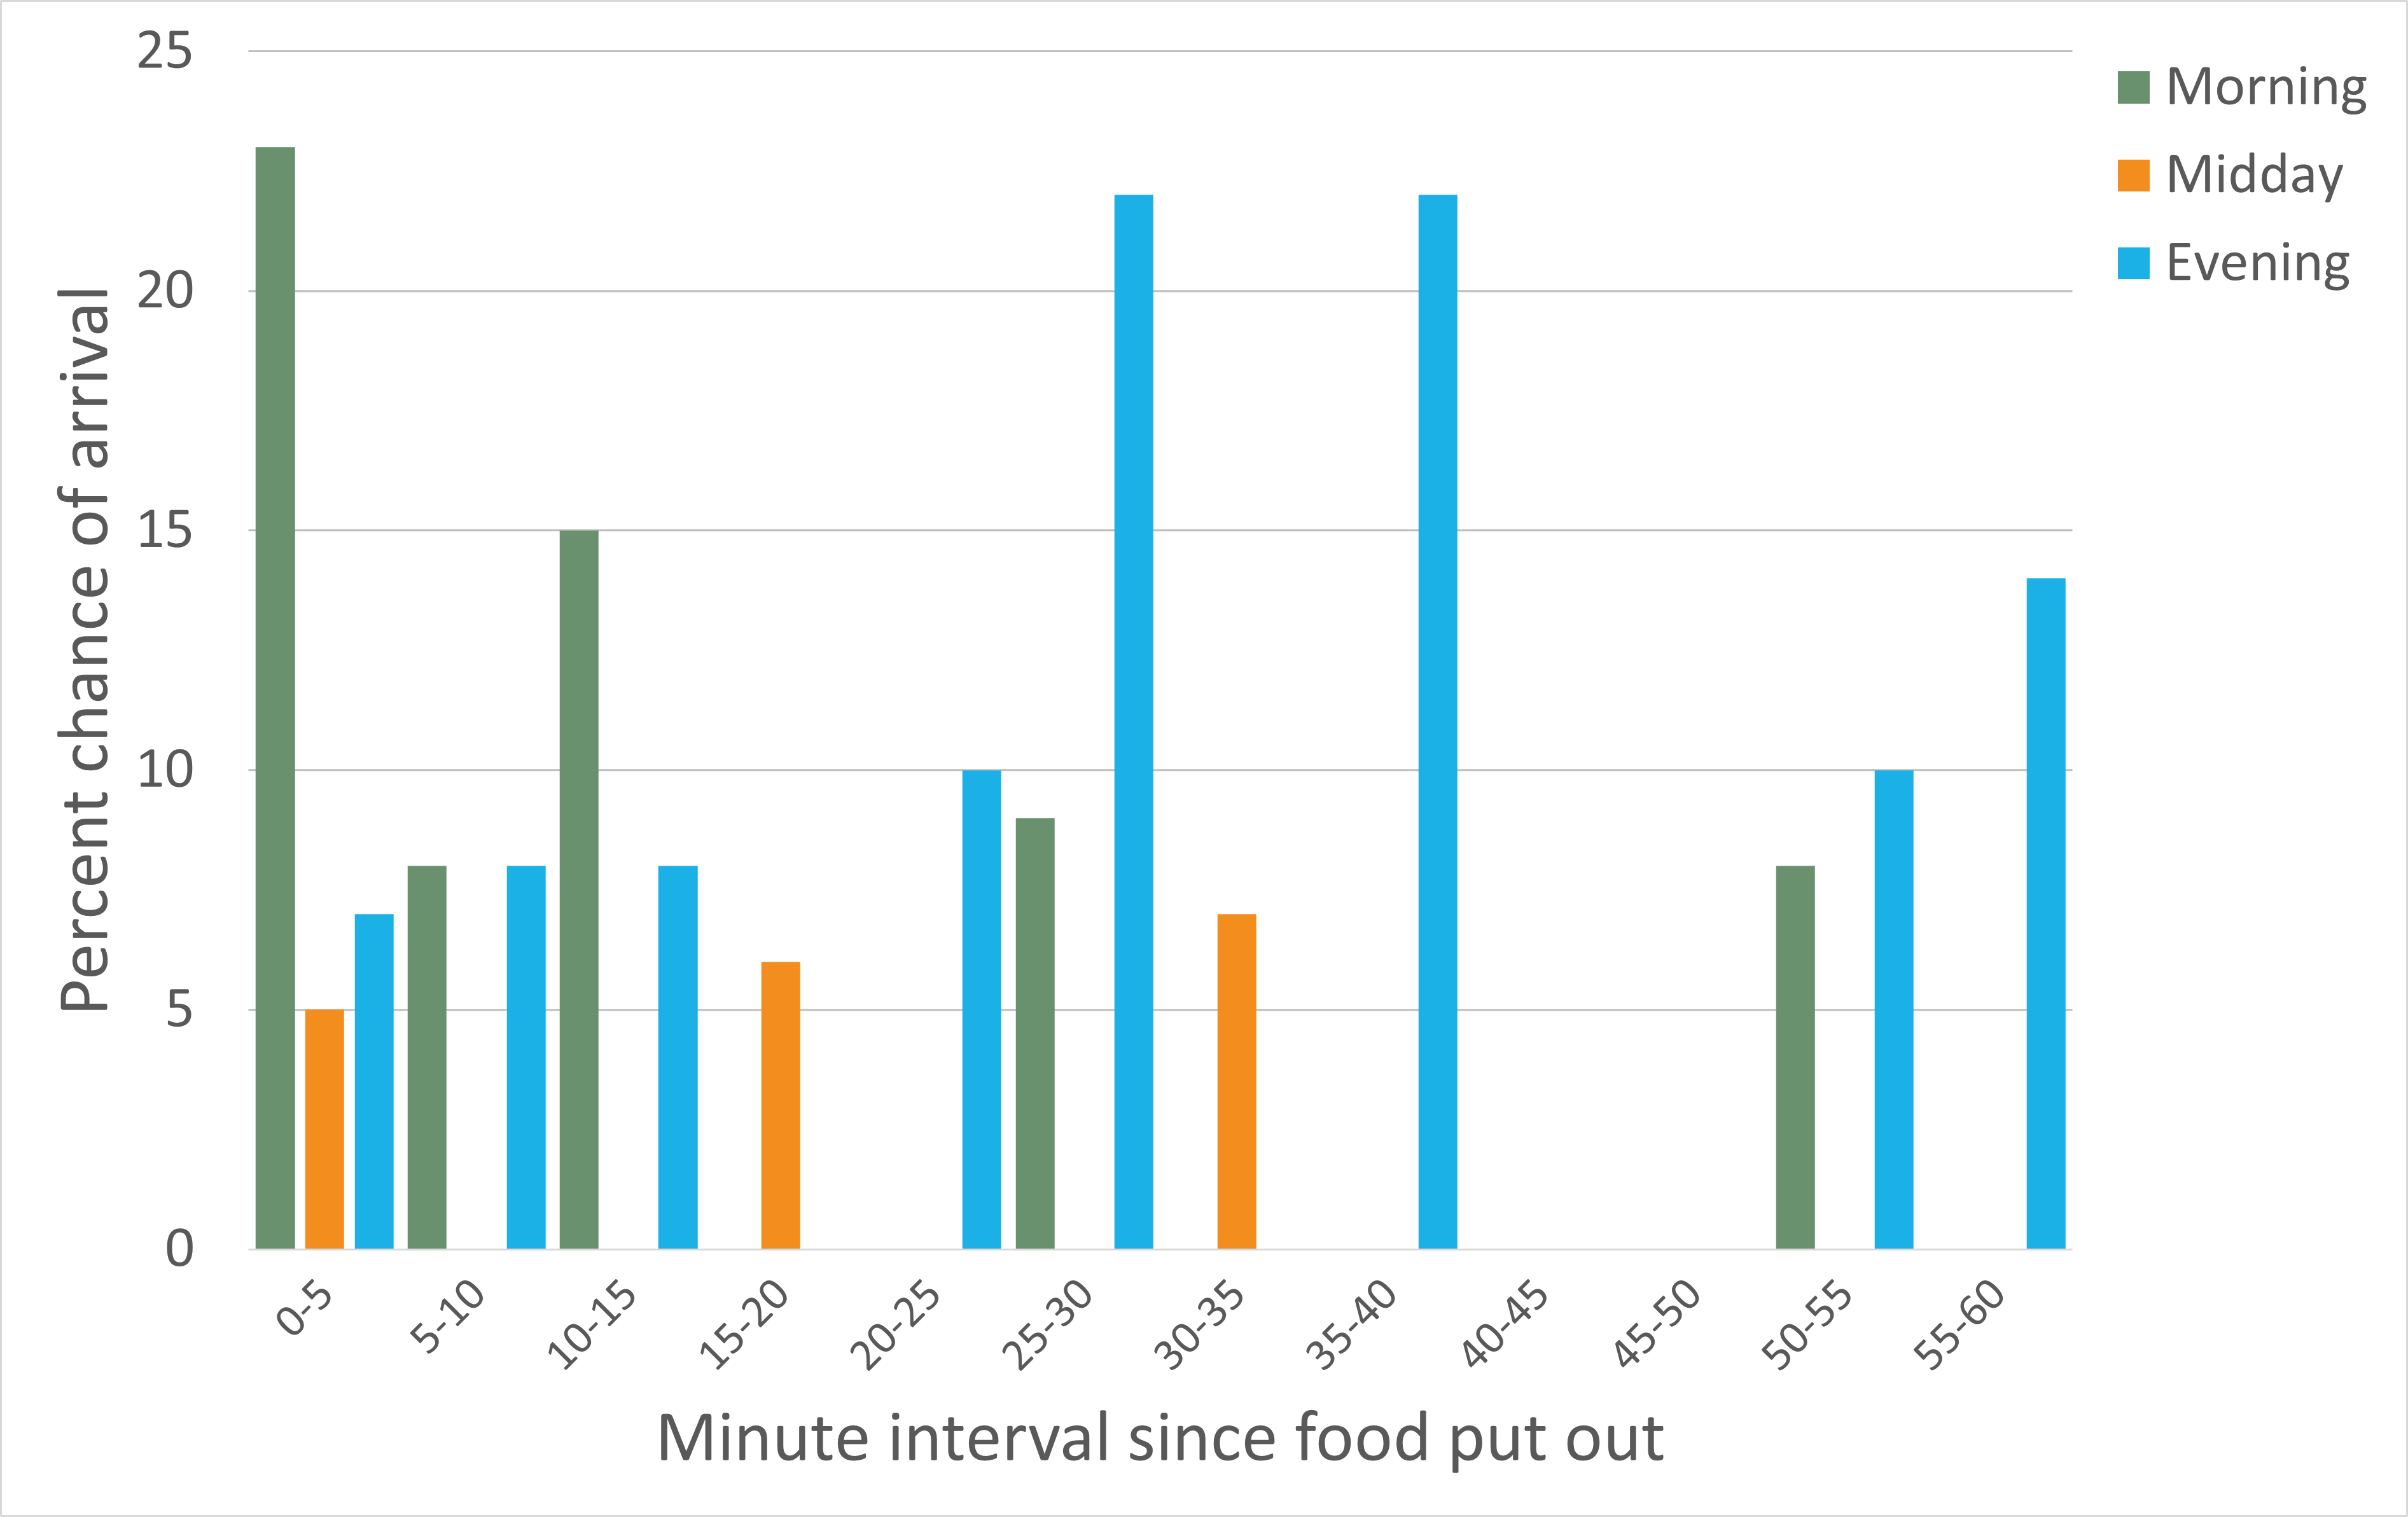
For the Rufous Motmot and the Gray-cowled Wood-Rail, the timing of arrival varied in interesting ways with respect to the presence of food. Depending on the time of day, the Rufous Motmot was more likely to arrive close to when food was put out or 30–60 minutes after (Figure 9).
Rufous Motmots Varied In How They Related To Food Being Replenished By Time Of Day
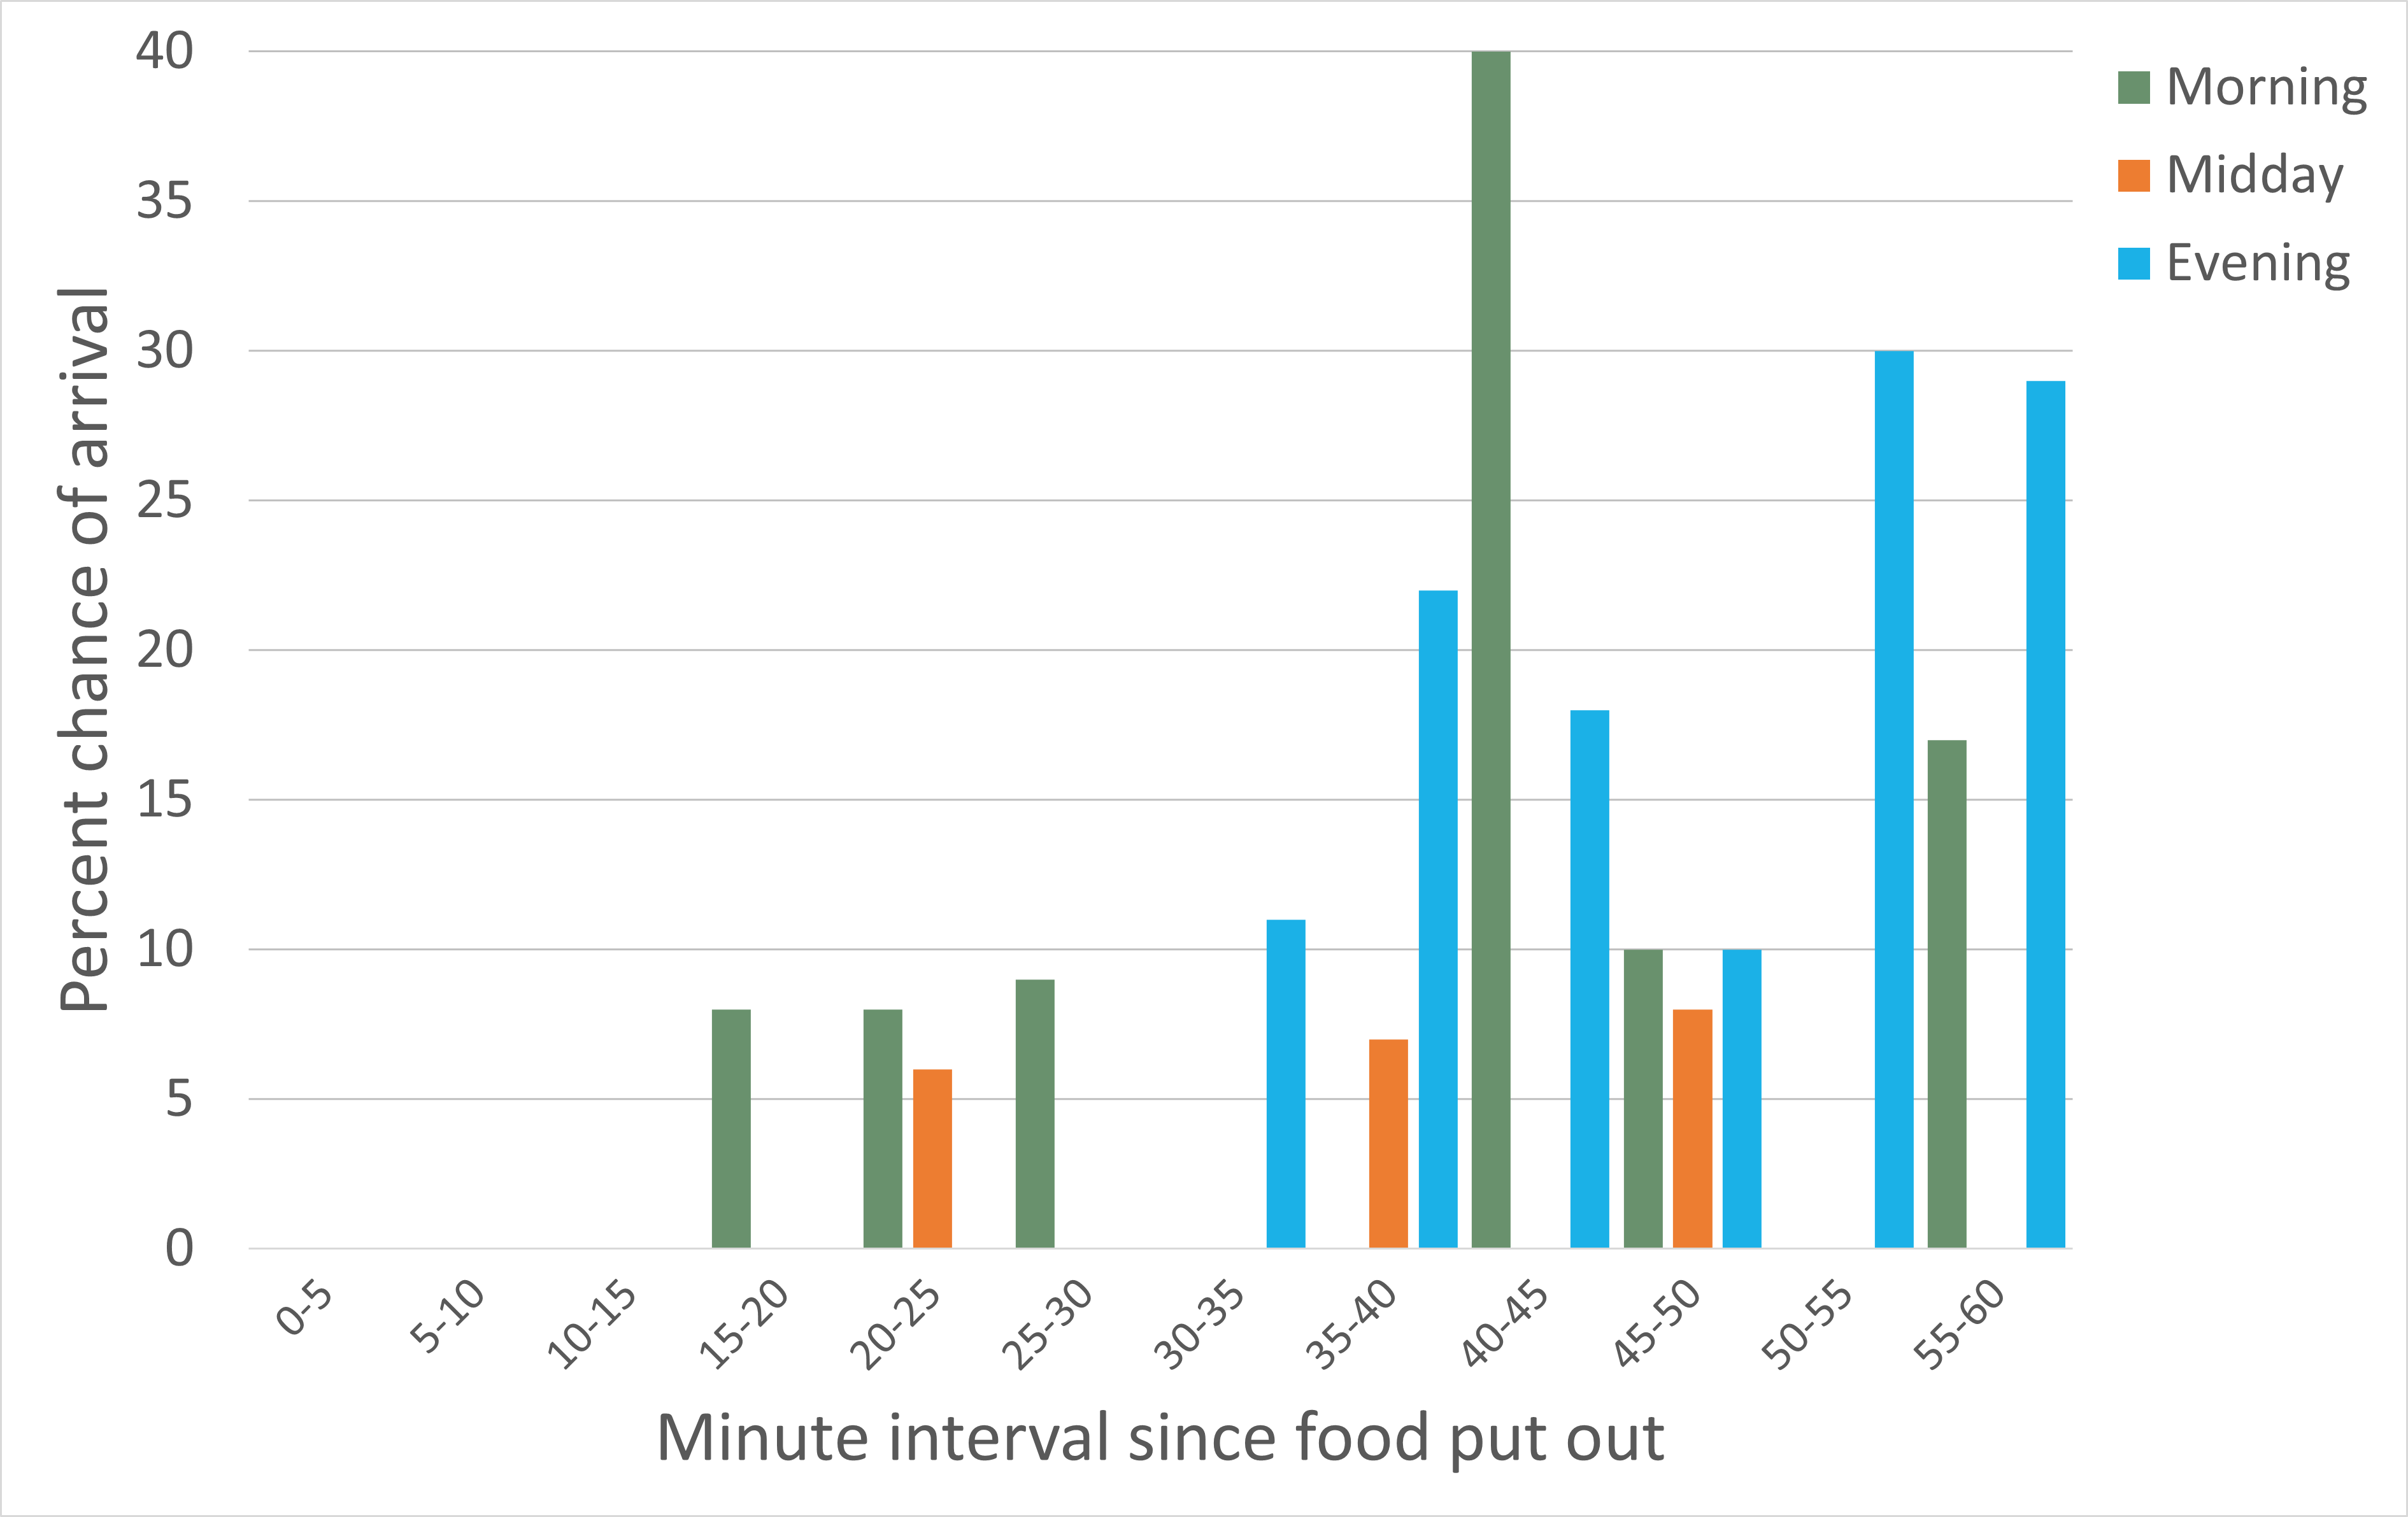
Regardless of the time of day when the feeder was replenished, the Gray-cowled Wood-Rail was more likely to have a delayed arrival (Figure 10). This pattern was unexpected, but a conversation with the community surfaced several intuitive ideas (or hypotheses) that could explain this pattern. Rails are a group of birds that are known to be secretive compared to other birds. The Gray-cowled Wood-Rail could potentially be avoiding other species, such as noisy Gray-headed Chachalacas, and act as the “clean-up crew.” Alternatively, the Gray-cowled Wood-Rails could be using the presence of other species, like the Clay-colored Thrushes, as a signal that food is available, resulting in a delay in their arrival relative to when the food is added to the feeder.
Delay In Arrival Of Gray-cowled Wood-Railed After Food Is Provided
Conclusion
Our investigation into when birds arrived on the Panama Fruit Feeder cam revealed potentially meaningful species differences and interesting patterns. Certain species seemed to arrive throughout the day while others arrived more often in the morning or evening. There was daily variation in the arrival of species and the presence of food appeared to affect the arrival of some species, but not others depending on the time of day. Discussions with the Bird Cams Lab community throughout the investigation highlighted that there are a number of important factors to take into consideration in this type of research, such as time of day and presence of food. We have only just scratched the surface.
We also now know that we can collect meaningful data in real time as a community while watching the cam, and learn what the birds are doing from the collected data. In exploring the data, we found new areas to consider for further development when collecting data in real time: variation in sampling effort, accuracy of observations, and how best to combine observations about the same event or behavior from multiple data collectors.
At this point we have successfully accomplished two firsts: (1) we completed a co-created investigation by viewers and scientists, and (2) collected data in real time from the Cornell Lab’s Panama Fruit Feeder cam. The next step towards publishing these results in a peer-reviewed scientific journal requires additional data collection over a longer time period and increasing our sample size by looking at other tropical feeders. We would also want to perform formal statistical analyses to gauge the likelihood that the patterns we see in the visualizations are meaningful, rather than generated by chance.
We’ll be starting up the next investigation with the Panama Fruit Feeder cam soon. We invite you to sign up for Bird Cams Lab if you have not already so that you will be the first to know when we launch it.
Acknowledgements
Thank you to everyone who participated in any or all parts of the Panama Live investigation: watching the cam, asking questions, collecting data, and exploring the data. We also thank the 12 volunteer reviewers who provided input on the final report. Panama Live was a co-created investigation and would not have been possible without the participation of the many citizen scientists along every step of the way.
Thank you as well to the Cornell Lab’s Web Communication team for helping design the live data tagging tool, online Field Guide, and other materials needed for this project.
This project was funded by the National Science Foundation grant 1713225. Any opinions, findings, and conclusions or recommendations expressed in this material are those of the author(s) and do not necessarily reflect the views of the National Science Foundation.