Cornell Feeders Live Final Report
July 30, 2021Summary
- Hundreds of people came together to work with researchers to design an investigation that looked at the birds visiting the Cornell FeederWatch cam.
- After weeks of sharing observations, discussing, and taking a vote, the community decided to investigate visitation patterns of eight species and the ways in which these patterns could be affected by weather.
- From March 31 to April 14, 2021, 495 people tagged data while watching the cam live, making more than 120,000 observations.
- Participants joined Bird Cams staff to explore the data in interactive visualizations online and in a live webinar, finding that species differed in their visitation patterns by date and time of day, but not by temperature.
- Many participants wondered about the influence of additional factors, such as other species visiting the feeder that we didn’t record, and they proposed ideas for what to do in the future.
- The results of this study add to our understanding of how birds visit feeders, and lays the groundwork for future research at other feeders.
Background
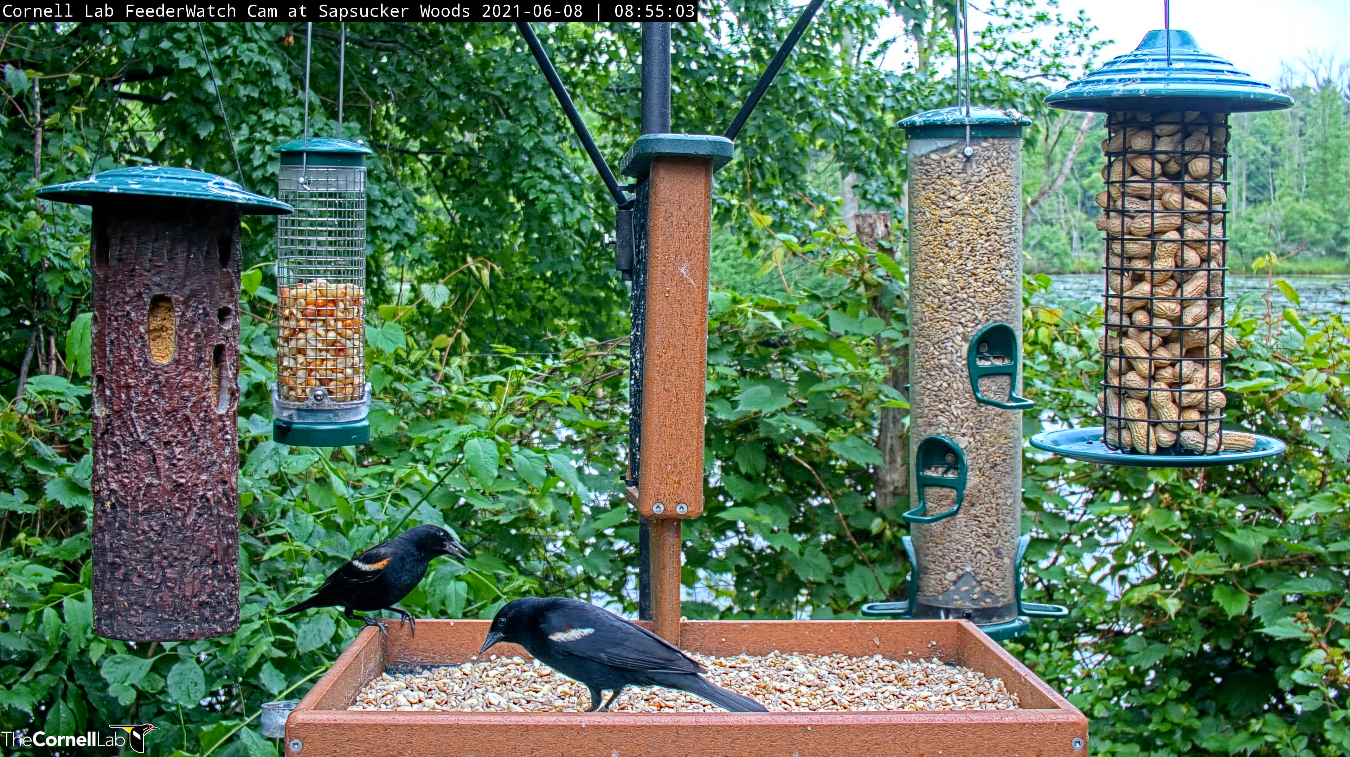
Sitting on the edge of Sapsucker Woods and a 10-acre pond in Ithaca, New York, the Cornell FeederWatch cam feeding station attracts a variety of species. Because of its unique location, it attracts forest species, such as the Black-capped Chickadee, and species who like more open spaces, such as the Red-winged Blackbird (Figure 1). This cam is also one of the Bird Cams’ popular cams, with over 124,600 people from around the world viewing the cam when we began the investigation.
In February, a group of new and long-time viewers joined forces with scientists to co-create a scientific investigation. Using two different forums, the Wonder Board and the Question Design Board, they spent a month sharing observations, brainstorming potential questions, and ultimately designing the study. On the Question Design forum, two questions rose to the top with the most votes from the community: (1) What is the daily visitation pattern of different species at the feeders? (2) How does weather affect the probability of different species visiting the feeders?
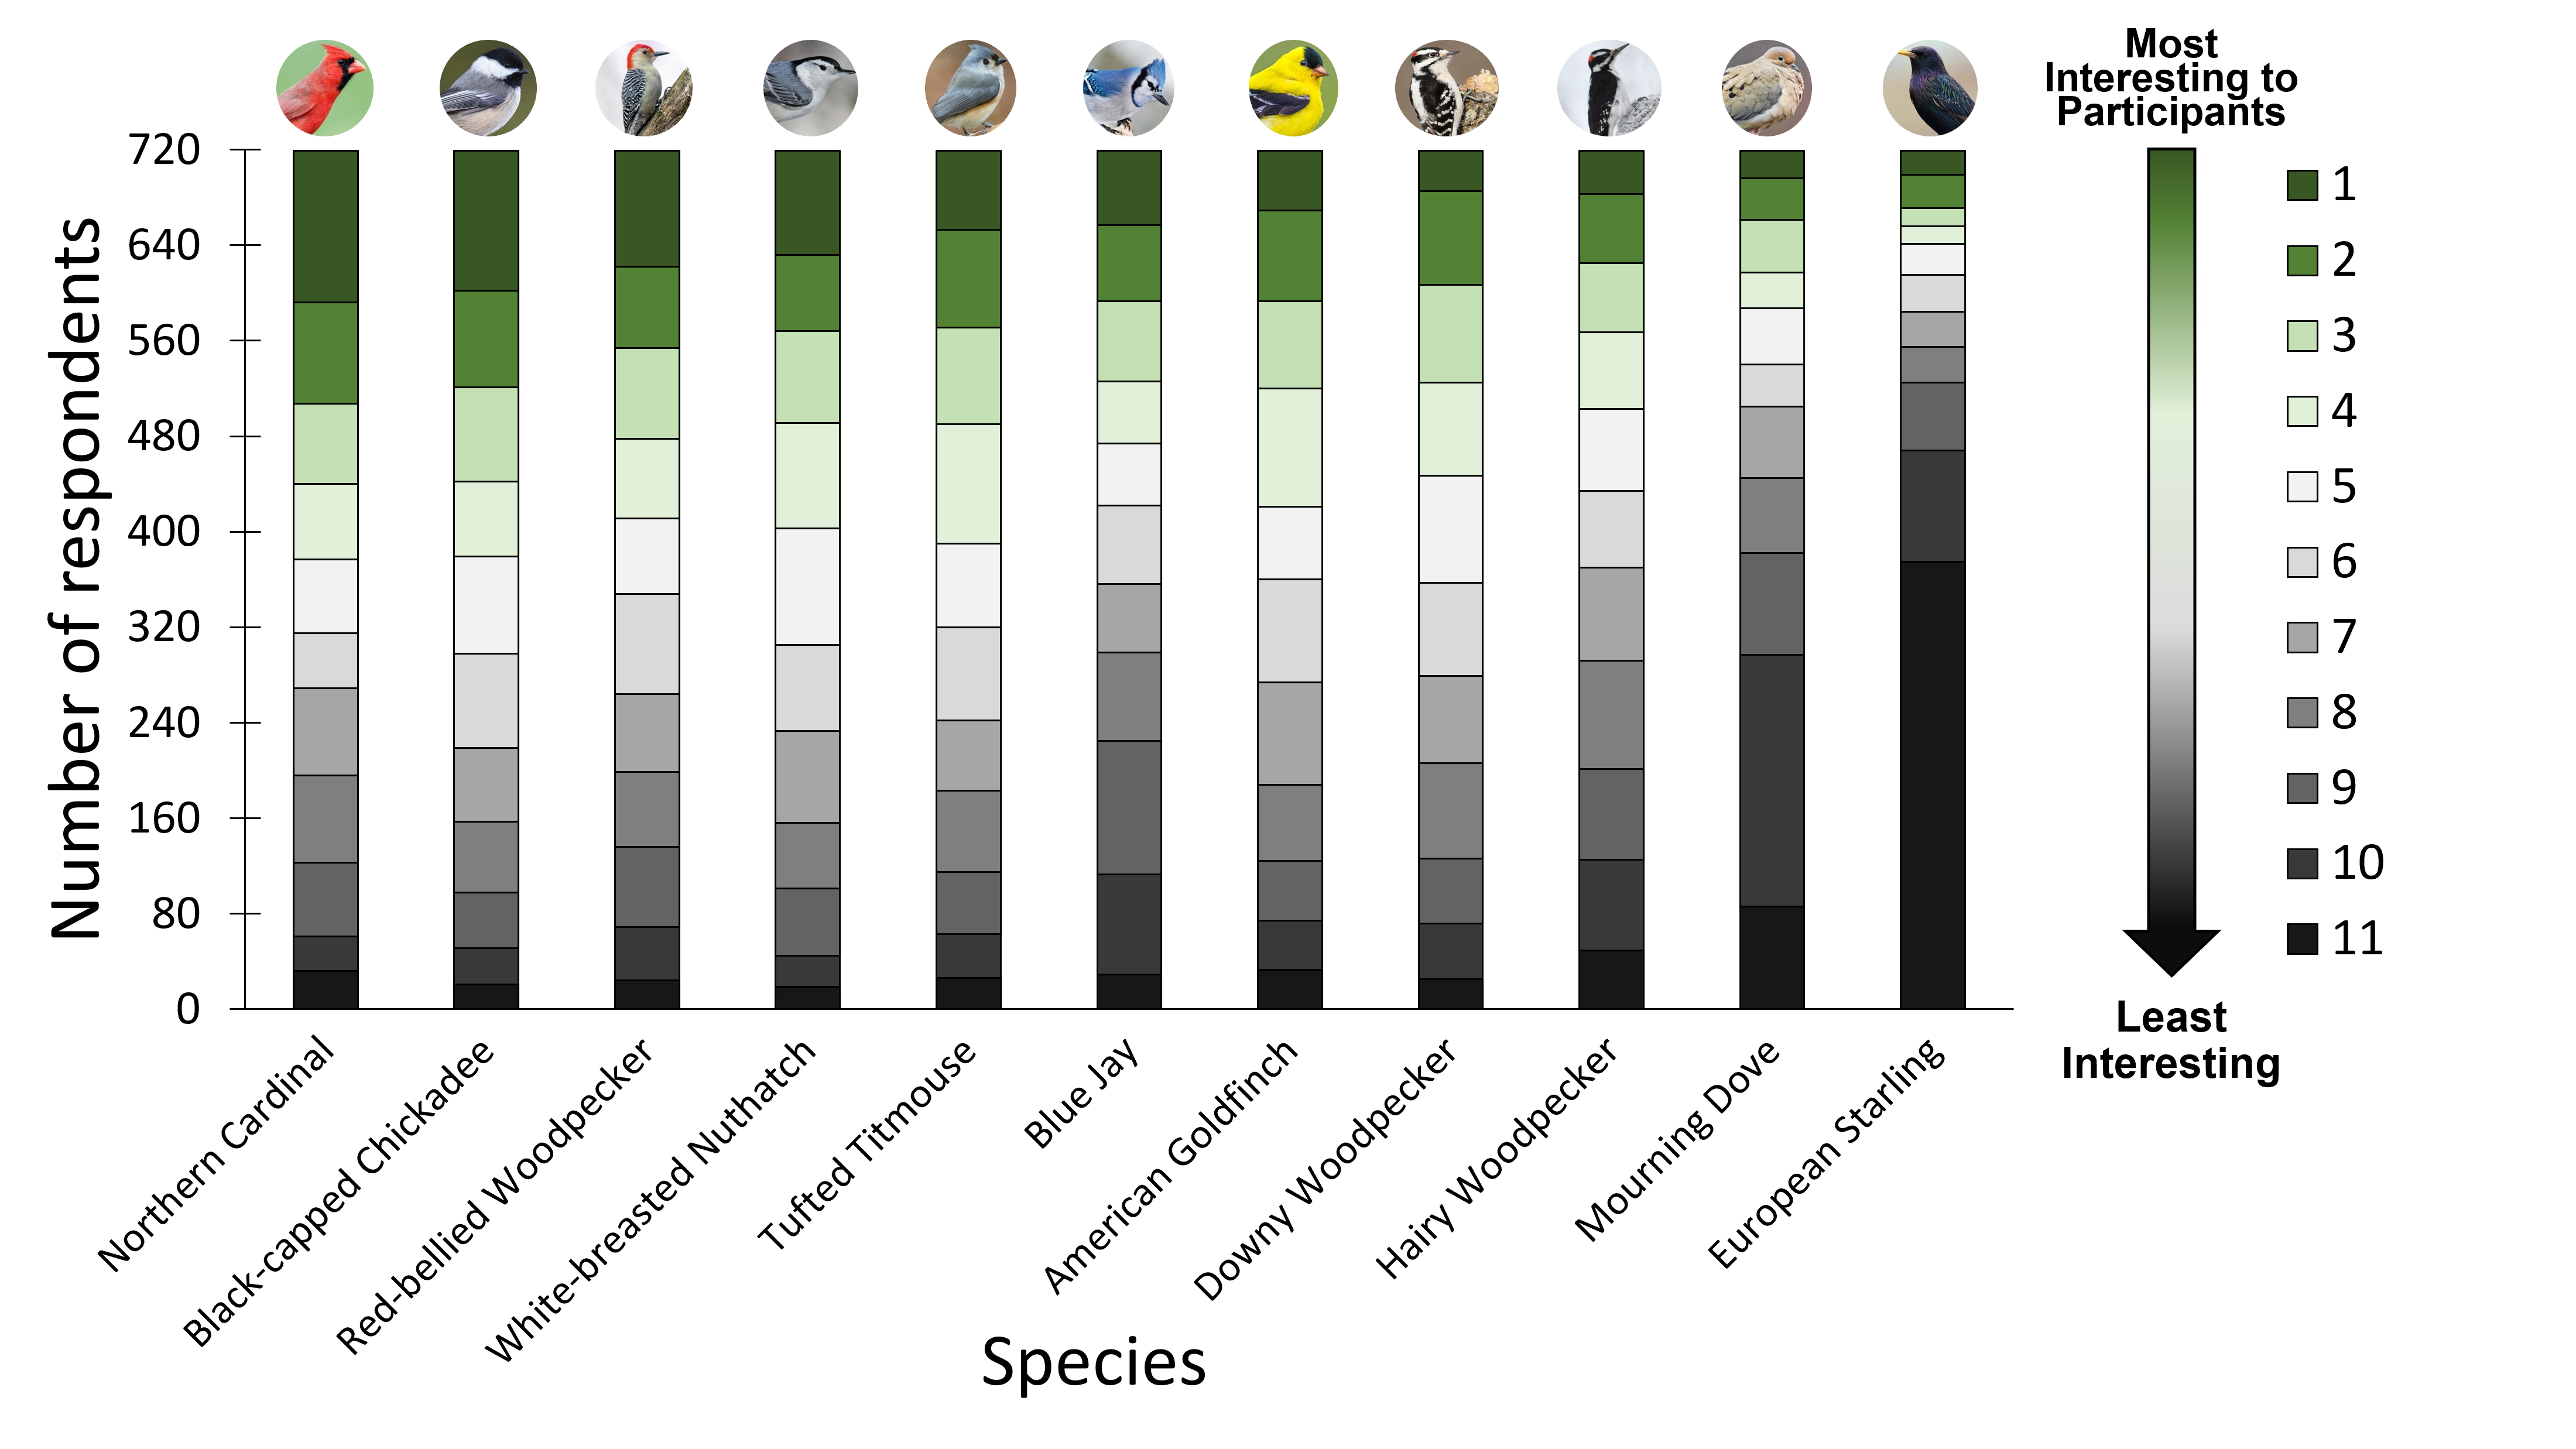
With questions in hand, 749 people from the community then weighed in on the study design by ranking potential species and weather variables according to their interest. We decided to study seven of the top-ranked species: Northern Cardinal, Black-capped Chickadee, Red-bellied Woodpecker, White-breasted Nuthatch, Tufted Titmouse, Blue Jay, and American Goldfinch (Figure 2). Additionally, we chose to collect data on the Red-winged Blackbird because it’s a very frequent visitor at the feeding station during the study period and relatively easy to identify.
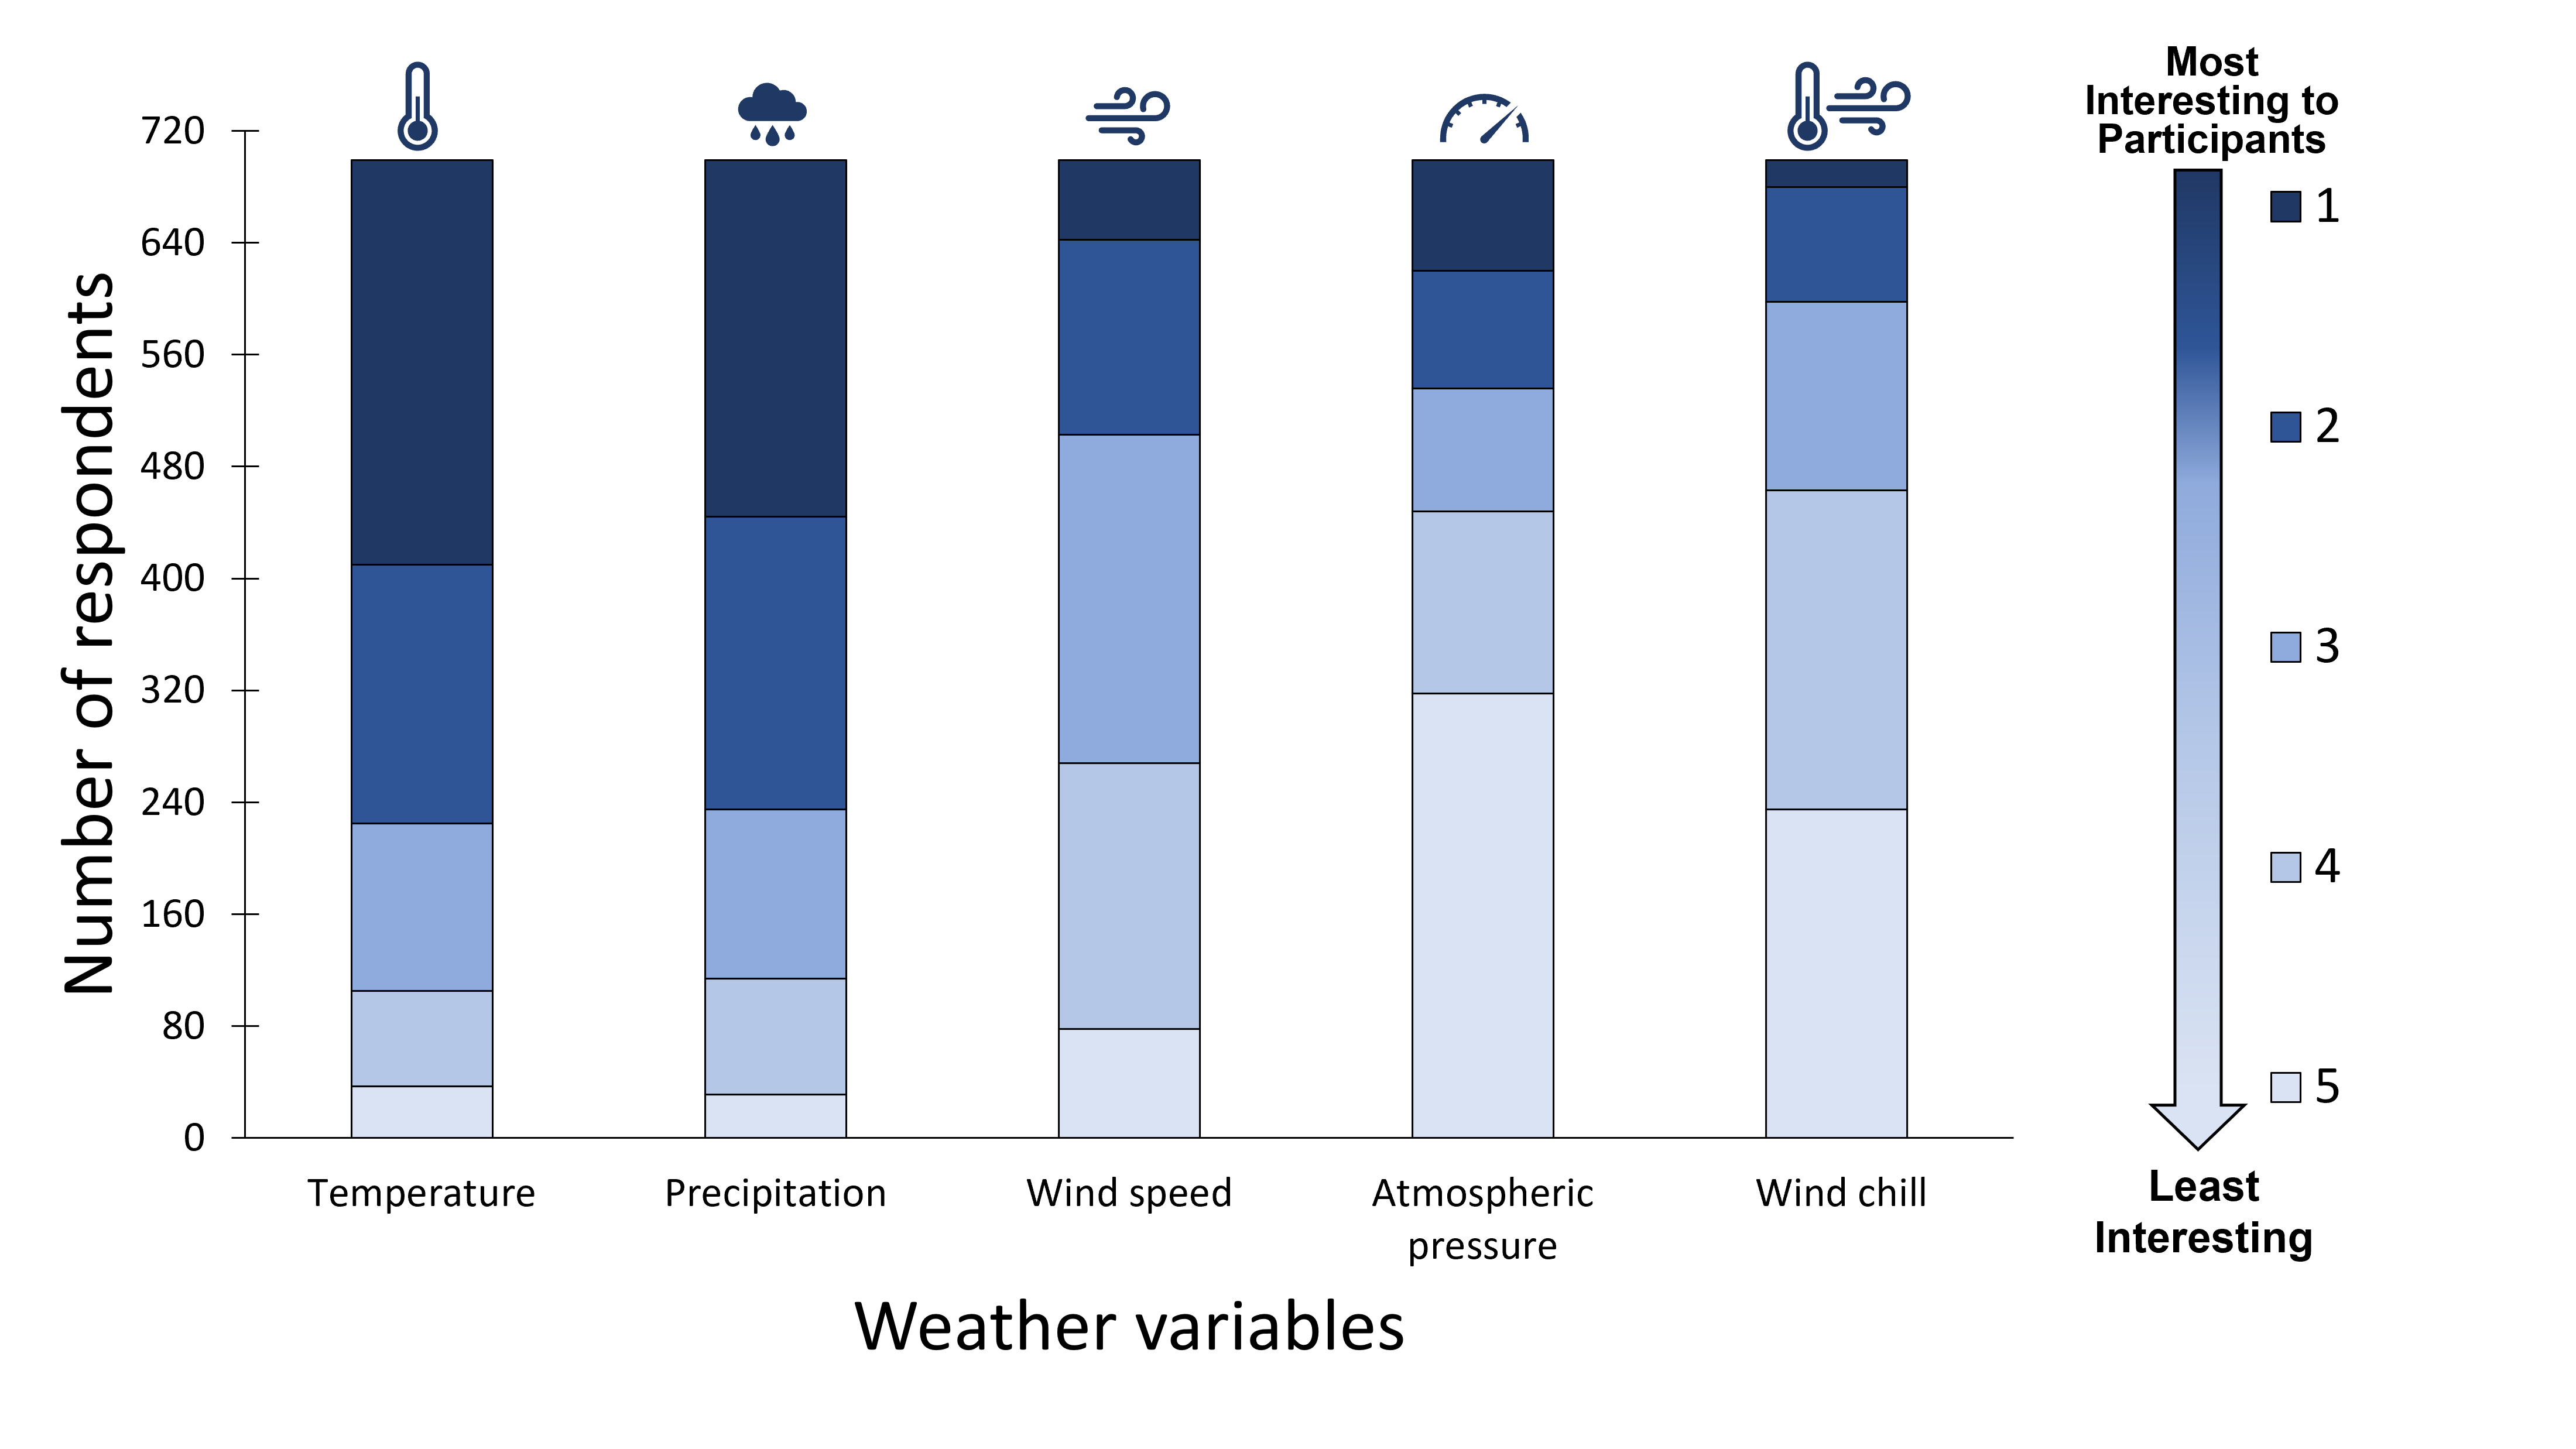
As for the weather variables, the community was most interested in investigating the effects of temperature and precipitation (Figure 3).
“Chickadees and blue jays might be particularly interesting since they are such different sizes — I wonder if small birds are more affected by weather changes than large birds.” –E.B. Fouts-Palmer
“I would really like to see the correlation of weather and the activity at the feeders. I think about this question often as I observe my feeders and try to make some sense of the effect of weather on our bird buddies.” –Bonnie Stalzer
While previous research has looked at daily visitation patterns and the effects of weather on foraging behavior (Bonter et al. 2013; Grubb, Jr. 1975, 1978), this has only been done for some of our study species (Black-capped Chickadee, Tufted Titmouse, and White-breasted Nuthatch). Additionally, daily visitation patterns and how they relate to weather have not been studied at this location.
Traditionally, researchers studying foraging behavior at or away from feeders would only be able to do so for relatively short periods of time and from far away to avoid disturbance. The Cornell FeederWatch cam gave us the opportunity to watch the feeder station throughout the entire day without disturbing the birds, thanks to the hundreds of observers who collectively were able to watch for far longer than any single researcher.
Methods
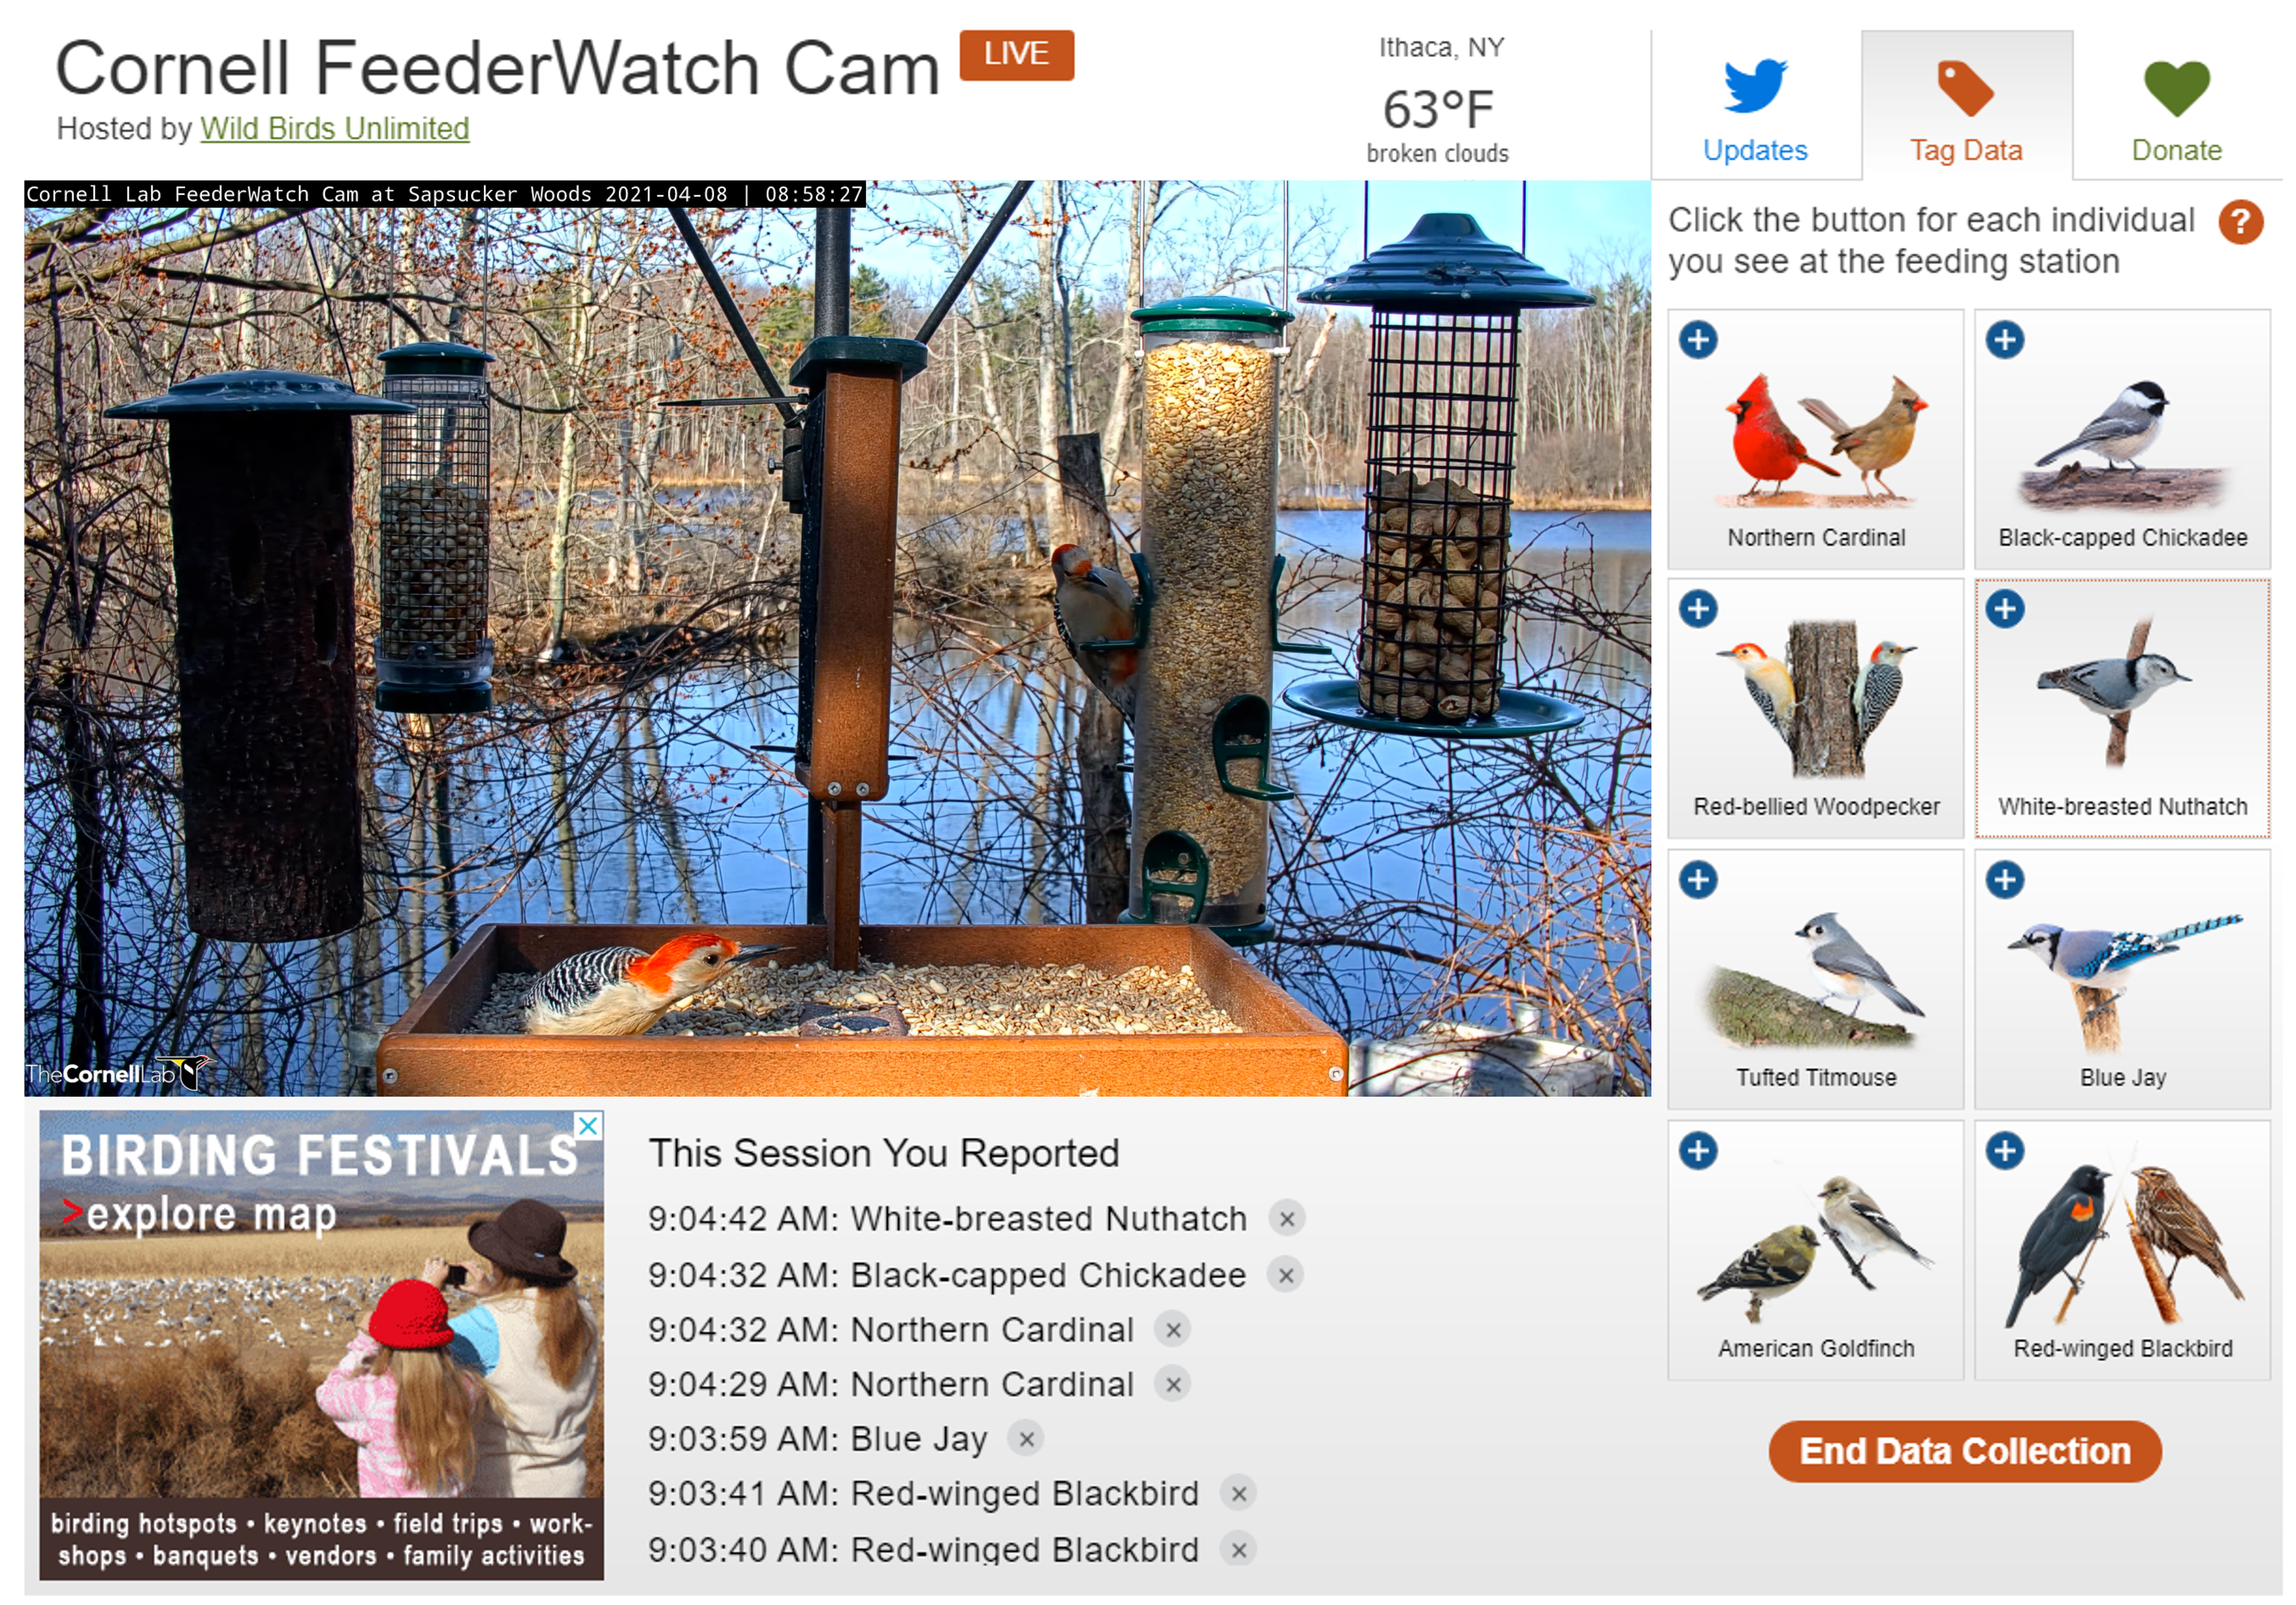
From March 31 to April 14, 2021, 495 participants watched the Cornell FeederWatch cam over a two week period and documented more than 120,000 observations using an online tool to tag events as they occurred in real time (Figure 4). Every time participants observed one of the eight study species land on any of the six feeders at the feeding station, they clicked a button to log it into the database.
Once we finished data collection, the Bird Cams Lab researchers prepared the data for the exploration phase so that everyone could access and explore the data together. The researchers calculated the likelihood of each species being present at the feeding station for half-hour intervals within a day and across days, and then created interactive visualizations (more details about this method can be found here). Using these visualizations, we started to answer our first question: What is the daily visitation pattern of different species at the feeders?
To answer our second research question, how does weather affect the probability of different species visiting the feeders, the researchers ran statistical analyses using temperature data pulled from the nearest weather station located at Ithaca Airport. While there was initial interest in understanding the effects of precipitation, there was not enough precipitation data to successfully run a model analysis. In the analysis, the researchers were also able to account for the potential effects of time of day and sampling date. Then, they created visualizations that explored how each predictor (temperature, time of day, sampling date) related to the percentage chance that a species was present at the feeding station (more details about this method can be found here).
Results and Discussion
We discussed the data visualizations in online forums and a live webinar (watch the archived recording). More than 334 people commented on or viewed the data visualizations online, and more than 250 people attended the live webinar or watched the recording afterwards. In both spaces, the community asked questions and shared their insights into what the data were telling us.
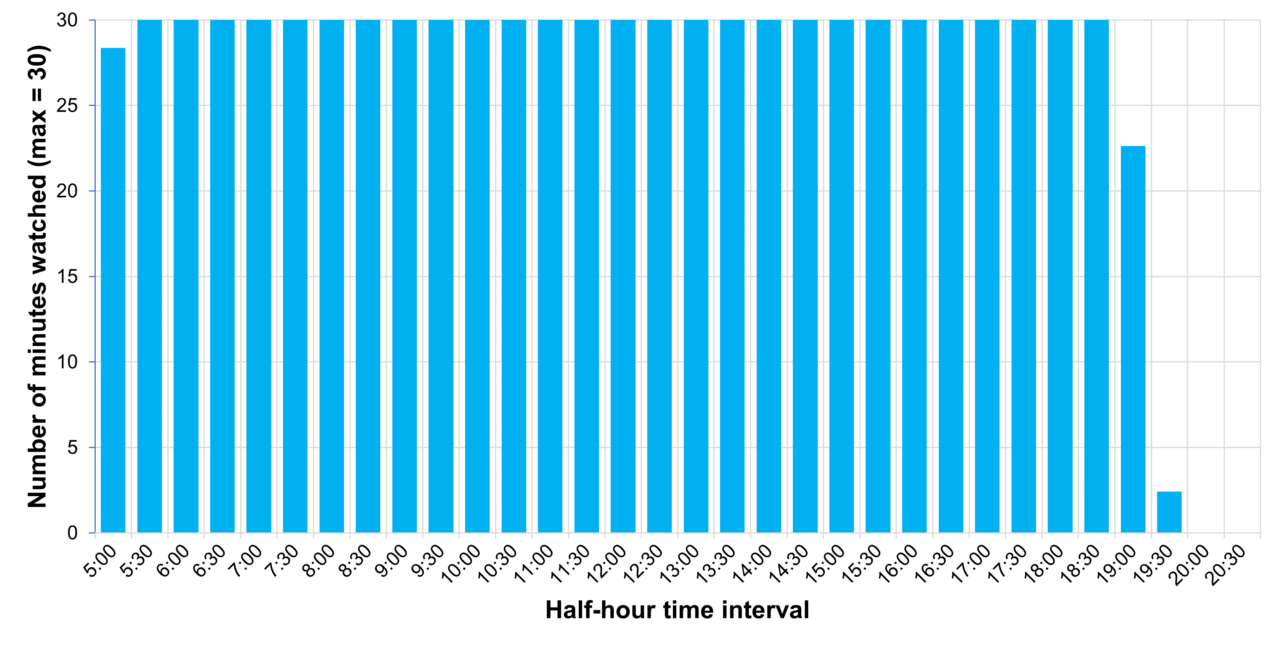
Thanks to the hundreds of data collectors, we had amazing coverage of daylight hours during the sampling period (Figure 5). While there was some variation in this sampling effort, most time periods during daylight hours were watched by at least one person.
“A lot of participation, generally pretty consistent, not only for the 14th, but for the entire time, with just a rare few gaps. That’s great coverage in my opinion!” –Becky R
“I agree @kittez. We even had participation pre-dawn dawn and after sunset. I suspect this was due to having observers from different time zones.” –Valerie Curtis
“I agree that we had a lot of participation with most hours covered nicely.” –Paula Fischer
There was at least one person watching most of the day on April 14
Research Question #1: What is the daily visitation pattern of different species at the feeders?
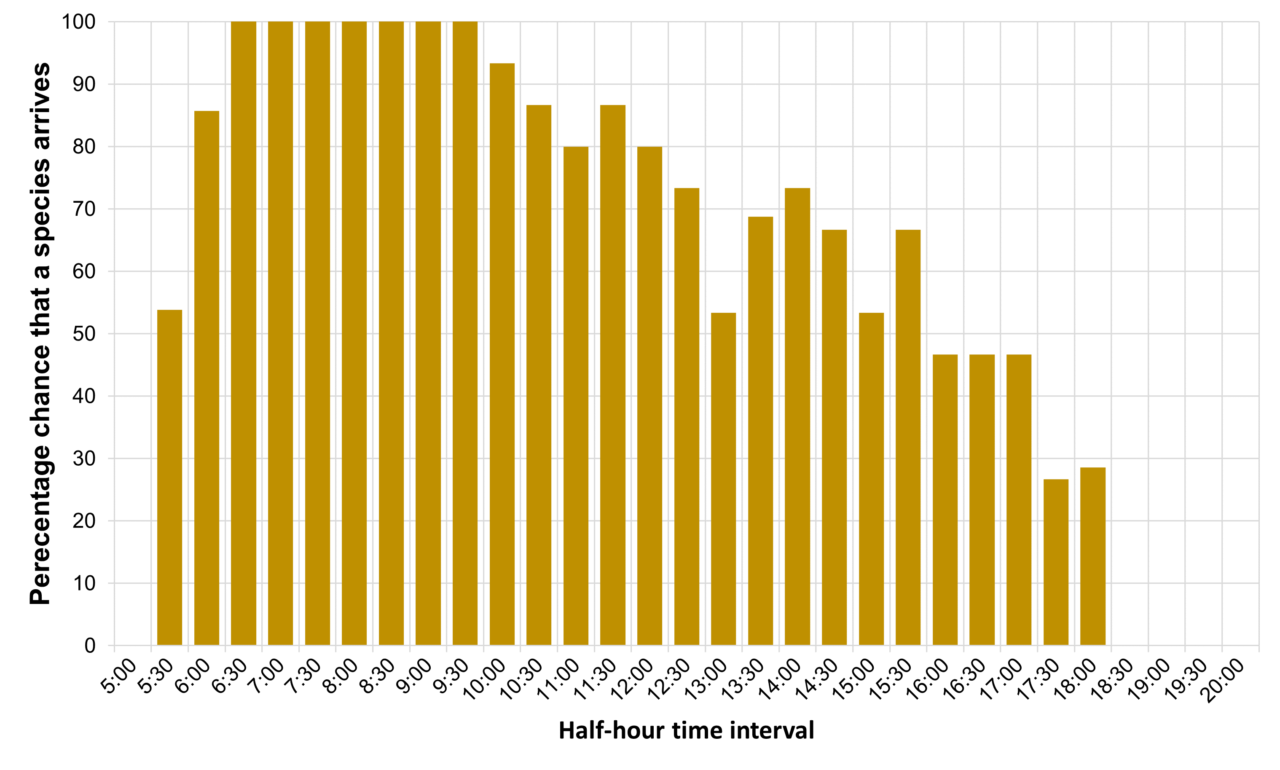
Within a day, the visitation pattern varied by species. For example, the percentage chance of a Blue Jay being at the feeding station was highest in the morning (Figure 6). In the live webinar, those attending echoed the thoughts of researchers in that the pattern was most likely driven by the availability of peanuts.
“Blue Jays are storing peanuts to eat later in the day.” –Barbara Duncan
Blue Jays were more likely to be at the feeding station in the morning
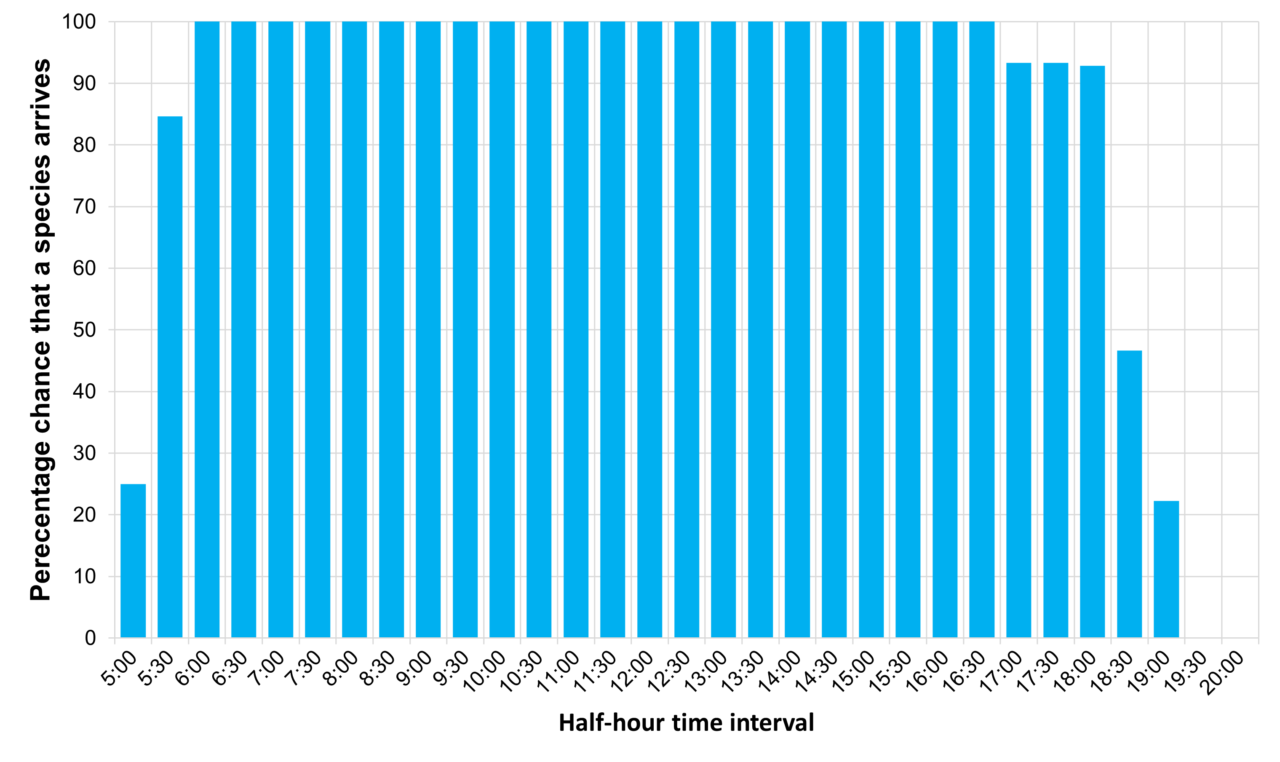
For other species, like the Red-winged Blackbird, the percentage chance of being at the feeding station was very high throughout the entire day (Figure 7). In the online forum, participant Rachel wondered if less precipitation this year could have driven more Red-winged Blackbirds to the feeding station.
“If the fields don’t get enough water, less food options for them [Red-winged Blackbirds]. I live in a rural area and in the past, had most often seen them in the fields.” –Rachel
Red-winged Blackbirds were at the feeding station throughout most of the day
The patterns we saw in the data were confirmed when we ran statistical analyses to investigate the effects of weather, and accounted for the potential variation due to hour of the day. For all species but the Northern Cardinal, the percentage chance that a species would be at the feeding station increased towards the middle of the day and then decreased, and with notable differences between species (Figure 8).
The percentage chance of a species being present depends on the time of day
Figure 8. The estimated percentage chance a species will arrive at the feeding station by hour (5:00 to 17:00) with 95% confidence bands (i.e., range in which we are 95% sure lies the true value). Each point represents the percentage chance of a species arriving during that hour, holding date and temperature at their average. Each species has its own color, and its data can be toggled on and off.
When it came to variation across the sampling period, from day to day, there were noticeable differences for some species, but not others. When we ran the statistical analysis and included the sampling date, we found that sampling date mattered for three of the study species: American Goldfinch, White-breasted Nuthatch, and Tufted Titmouse. As the sampling period progressed, the percentage chance that they would be present at the feeding station decreased (Figure 9).
The percentage chance of a species being present decreases with sampling date for three species
Figure 9. The estimated percentage chance a species will arrive at the feeding station by sampling date (March 31 to April 14) with 95% confidence bands (i.e., range in which we are 95% sure lies the true value). Each point represents the percentage chance of a species arriving, holding the other predictors (temperature and hour) at their average. Each species has its own color, and its data can be toggled on and off.
One participant suggested that this pattern could be driven by Common Grackles, which became more common at the feeding station at the time of year we collected data.
“I wonder if the Common Grackles which were not counted, but often present and aggressive, altered visitation by American Goldfinch, White-breasted Nuthatch, and Tufted Titmouse? I saw multiple displacements of almost all birds including members of their own species.” –Pat Wynn
Additionally, the effect of sampling date may have affected some species and not others due to differences in when they start to breed or changes in nearby food resources.
Research Question #2: How does temperature affect the probability of different species visiting the feeders?
Surprisingly, temperature did not seem to affect specie’s presence at the feeding station; the percentage chance that a species was at the feeding station was about the same at all temperatures (Figure 10). While it seems like there is a trend for the American Goldfinch of increasing percentage chance with increasing temperature, it is a very small increase and not statistically significant.
This confirmed what we saw in the raw data before we ran the analysis. Participant Sue O’Brien pointed out, “If I compare the temp charts to the time charts, temp doesn’t seem to matter as much as time. All species are adapted to the spring temps.” This could also be due to the way in which we assessed visitation: by presence or absence of each species during an hour interval. Temperature may have an effect on the number of visits of species, but we were not able to capture that data in this investigation.
Temperature does not affect the percentage chance a species is present
Figure 10. The estimated percentage chance a species will arrive at the feeding station by temperature with 95% confidence bands (i.e., range in which we are 95% sure lies the true value). Each point represents the percentage chance of a species arriving during that temperature, holding all other predictor variables at their average. Each species has its own color, and its data can be toggled on and off. To view temperature in Fahrenheit or Celsius, click on the gray tabs above the visualization.
Interestingly, all species but the American Goldfinch had very high percentage chances of being at the feeding station (from 70-100% across temperatures). This may have been due to the fact that American Goldfinches are “leap-frog” foragers, and are known to move in flocks from feeder to feeder based on food availability and perceived predation risk (Middleton 1970, Newton 1972), or are less abundant than other species like the Black-capped Chickadee and Red-winged Blackbird in the area at this time of year.
Conclusion
Our investigation into the foraging behavior of common species on the Cornell FeederWatch cam this past spring was the first-ever co-created investigation with this cam. We discovered that species differ in how they visited the feeding station, and that time of day was more important than temperature in explaining visitation patterns.
While we explored the data, participants were already thinking about how we would change or improve this study if we did it again in the future.
“Grackles, starlings–they are ever present at that time of year, so the data is incomplete without them. Maybe some birds that are still migrating–Rose-breasted Grosbeak?” –Sue O’Brien
“We could try marking arrival and departure times of individuals and seeing if the arrival of a given species (such as the grackle) tends to disproportionately occur just before the departure of another (such as the goldfinch). It wouldn’t prove causality but establishing the correlation could be a useful indicator.” –Matt Eckstein
We hope future studies will be able to look at visitation on a finer scale than presence/absence, such as the number of visits. We were able to combine observations from multiple people watching the cam and look at the presence or absence of species. In future investigations, we may be able to figure out a methodology to differentiate the number of visits of species, and potentially even individuals if they are banded. Participant Karen Foster brought up this idea in the forums: “I think this effort might be exploratory–for developing a method of determining consensus on observations in the future. But this data could hold surprises.”
As with many scientific investigations, questions lead to more questions! We hope that the data we collected can inform future investigations that could expand on our observations, such as studying different species, multiple feeders, and collecting data during other times of year. It would also be interesting to see if the patterns we discovered reflect broader trends.
Acknowledgements
Thank you to everyone who participated in any or all parts of Cornell Feeders Live: watching the cam, asking questions, collecting data, exploring the data, and sharing the findings. We also thank the 15 volunteer reviewers who provided input on the final report. Cornell Feeders Live was a co-created investigation and would not have been possible without the hundreds of participants every step of the way.
Thank you as well to the Cornell Lab’s Web Communications team for designing the live data tagging tool and online collaboration spaces needed for this project.
Photo credits for Figure 2: Northern Cardinal by Alix d’Entremont/Macaulay Library; Black-capped Chickadee by Scott Martin/Macaulay Library; Red-bellied Woodpecker by Carl Geometti/Macaulay Library; White-breasted Nuthatch by Ryan Schain/Macaulay Library; Tufted Titmouse by Ben McGann/Macaulay Library; Blue Jay by bellemare celine/Macaulay Library; American Goldfinch by Adam Jackson /Macaulay Library; Downy Woodpecker by Evan Lipton/Macaulay Library; Hairy Woodpecker by Nate Brown/Macaulay Library; Mourning Dove by Ryan Schain/Macaulay Library; European Starling by Dan Vickers/Macaulay Library.
This project was funded by the National Science Foundation grant 1713225. Any opinions, findings, and conclusions or recommendations expressed in this material are those of the author(s) and do not necessarily reflect the views of the National Science Foundation.
References
Bonter, D. N., Zuckerberg, B., Sedgwick, C. W., & Hochachka, W. M. (2013). Daily foraging patterns in free-living birds: exploring the predation-starvation trade-off. Proceedings. Biological Sciences, 280(1760). https://doi.org/10.1098/rspb.2012.3087.
Grubb, Jr., T.C. (1975). Weather-Dependent Foraging Behavior of Some Birds Wintering in a Deciduous Woodland, The Condor, 77(2):175–182, https://doi.org/10.2307/1365788.
Grubb, Jr., T.C. (1978). Weather-dependent Foraging Rates of Wintering Woodland Birds. The Auk, 95(2): 370–376. https://doi.org/10.1093/auk/95.2.370.
Middleton, A. L.A. 1970. Foods and feeding habits of the European Goldfinch near Melbourne. Emu, 70:12-16.
Newton, I. 1972. Finches. Taplinger, Englewood-Cliffs, NJ, USA.