Skip to Content Area
Contact Us
Donate
Bird Cams Lab
Home
About
About the Project
Project Updates
The Team
Learn
Resources
Code and Data
Investigation Archive
Cornell Feeders Live
Battling Birds: Panama Edition
Hawk Happenings
Panama Live
Hawk Talk
Battling Birds
Contact Us
Donate
Search
Menu
Bird Cams Lab
Bird Cams Lab
Categories
Skip to Content
Bird Cams Lab
Battling Birds Resources
Battling Birds: Panama Edition
Cornell Feeders Live
Hawk 2 Resources
Hawk Resources
Learn
Panama Feeder Resources
Wonder Board
Sort By
Date - Newest First
Date - Oldest First
Title A-Z
Title Z-A
Discuss New Findings At Live Webinar
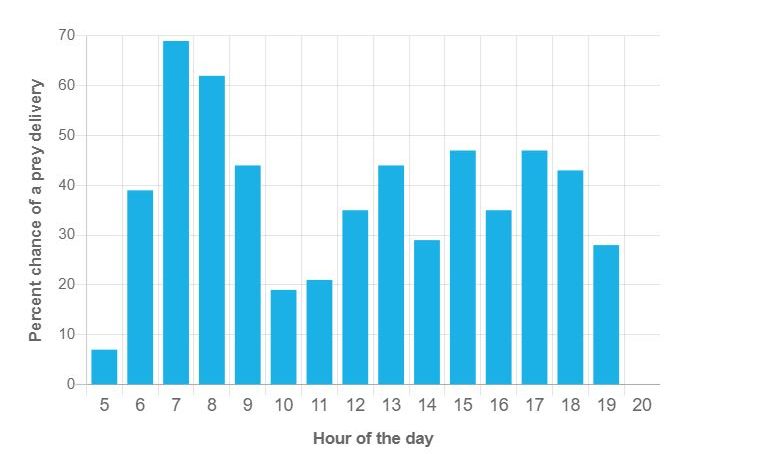
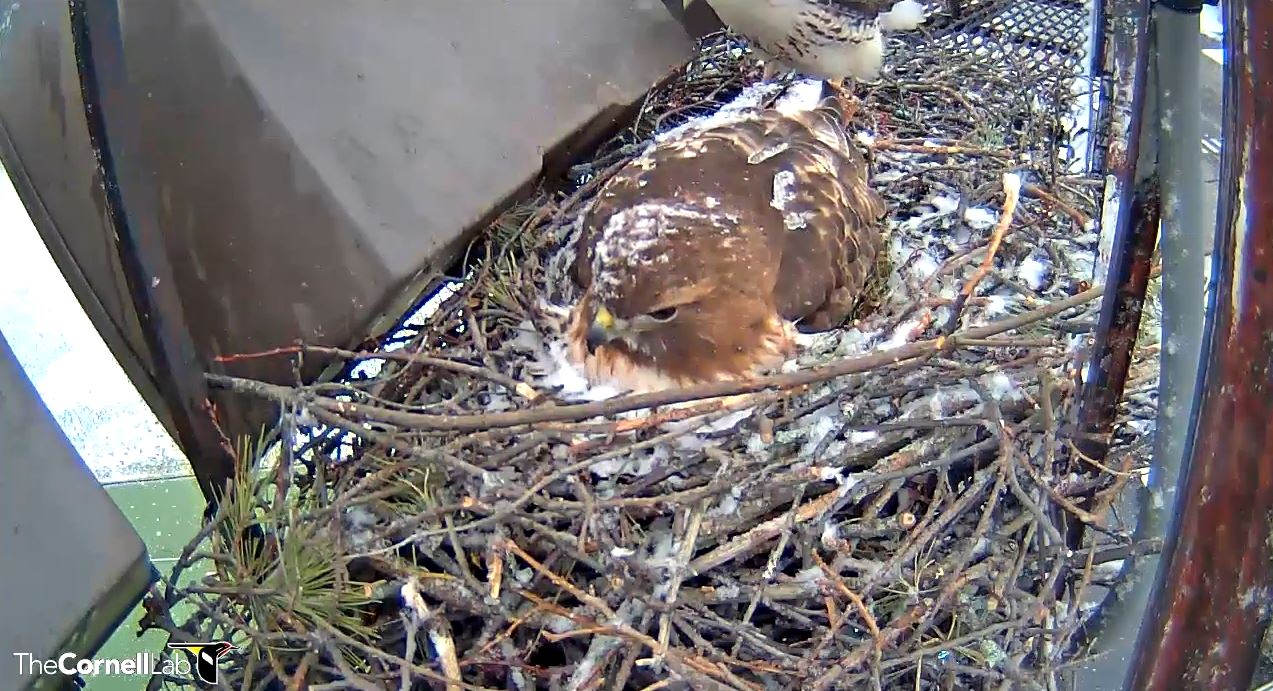
Nestlings snack all day on the prey delivered in the morning or afternoon
Explore the Hawk Happenings Data
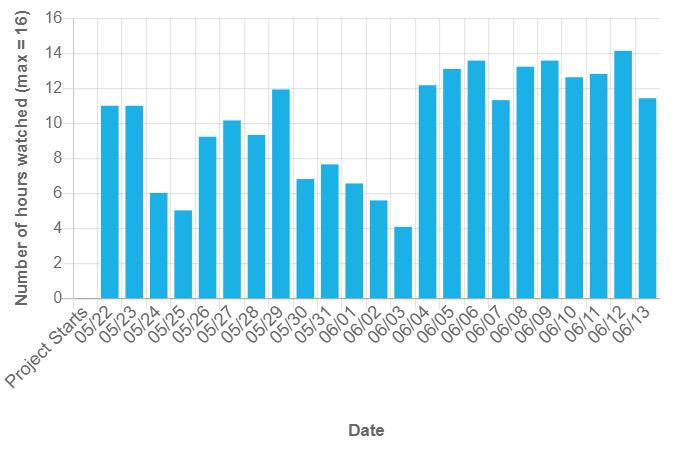
When were (or weren’t) we watching?
Community inspires deeper dive into the data
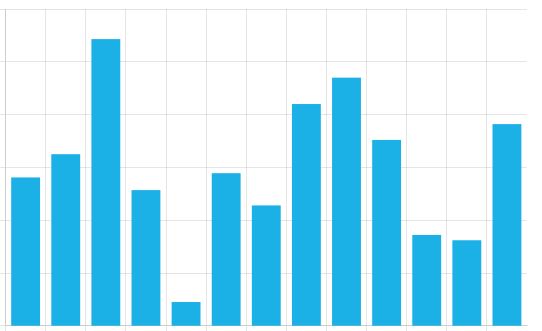
Hawk Happenings: From Observations to Visualizations
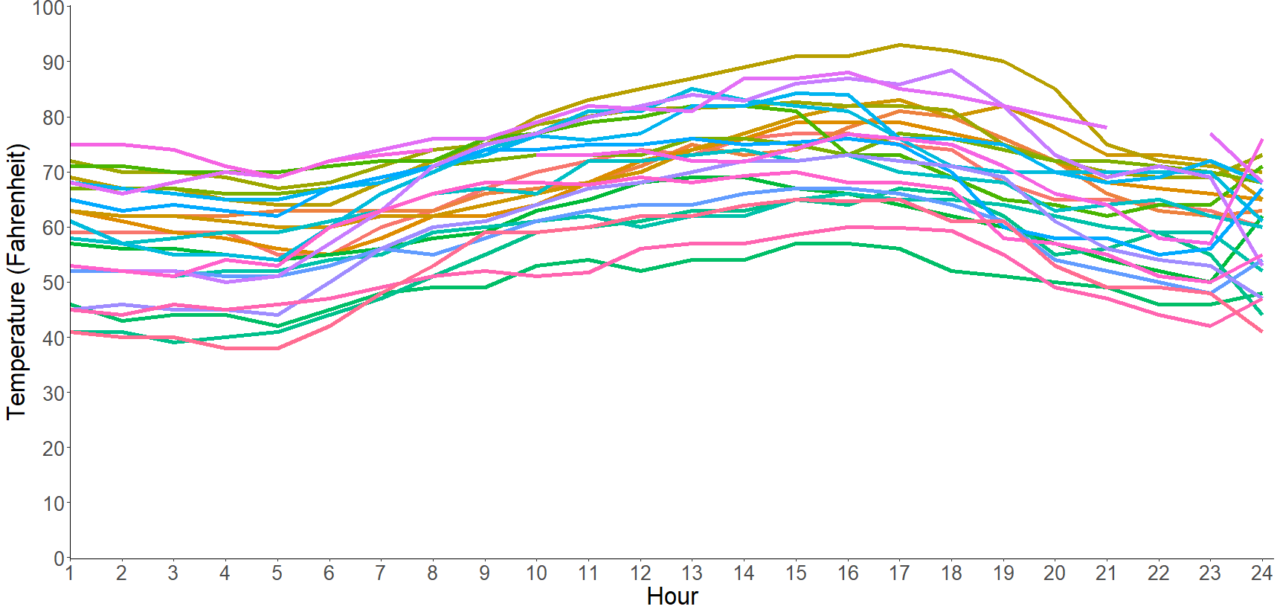
What does the weather data look like?
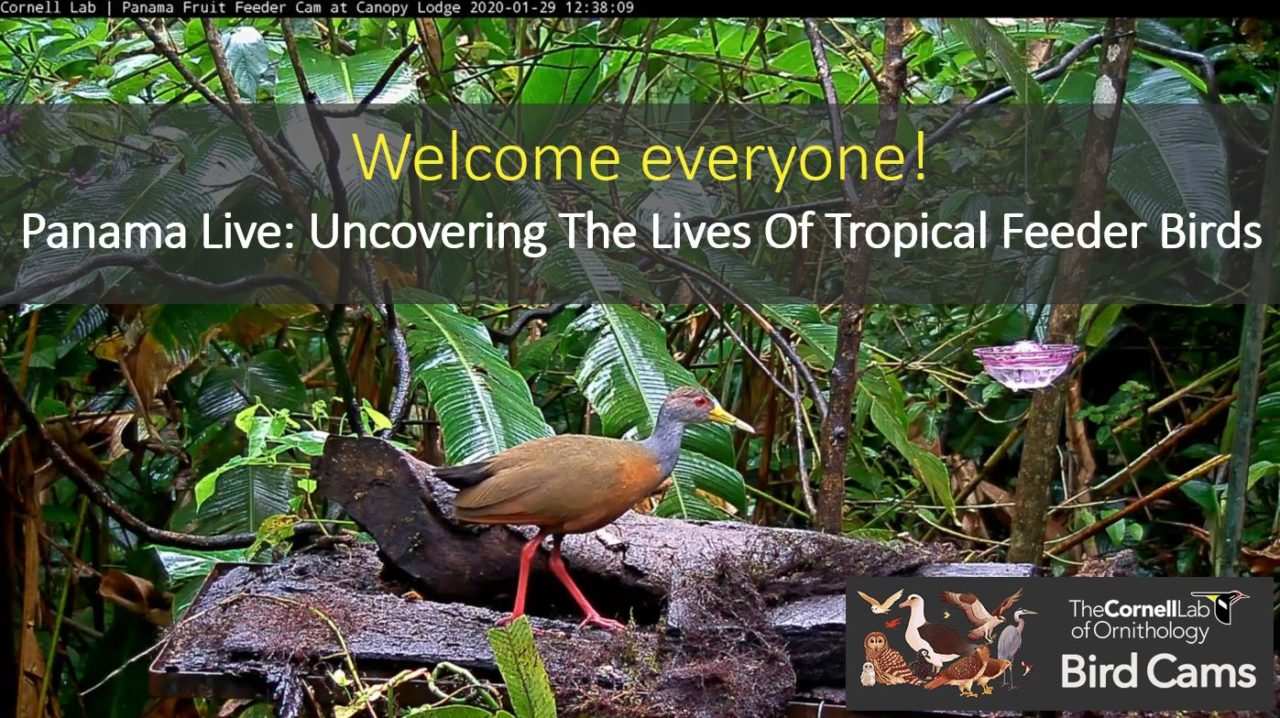
Live from Bird Cams Lab: Virtual Event Uncovers the Lives of Tropical Feeder Birds
Learn About Tropical Birds At Live Webinar
«
1
2
3
4
5
6
7
8
9
10
11
12
13
»
Close
×
Search this website