Battling Birds: Panama Edition Final Report
June 23, 2021Summary
- Inspired by community interest in previous Bird Cams Lab investigations about aggressive interactions between birds at feeders, we collaborated with Dr. Eliot Miller to learn more about the social relationships among the birds seen on the Panama Fruit Feeder cam.
- The Bird Cams Lab community worked with Dr. Miller and other Cornell Lab of Ornithology scientists to design the investigation, including what data to collect.
- From January to February 2021, more than 1,300 people watched 18,218 video clips and made 135,160 observations.
- While exploring preliminary findings online and in a live webinar with scientists, the community found that the heavier species had the higher dominance scores.
- The preliminary findings also confirmed what many data collectors noticed when making observations: certain species, like the Clay-colored Thrush, initiated more displacements than others.
- This study is a first step to better understand the relationships among different species that visit feeders in Panama and elsewhere in the tropics.
Background
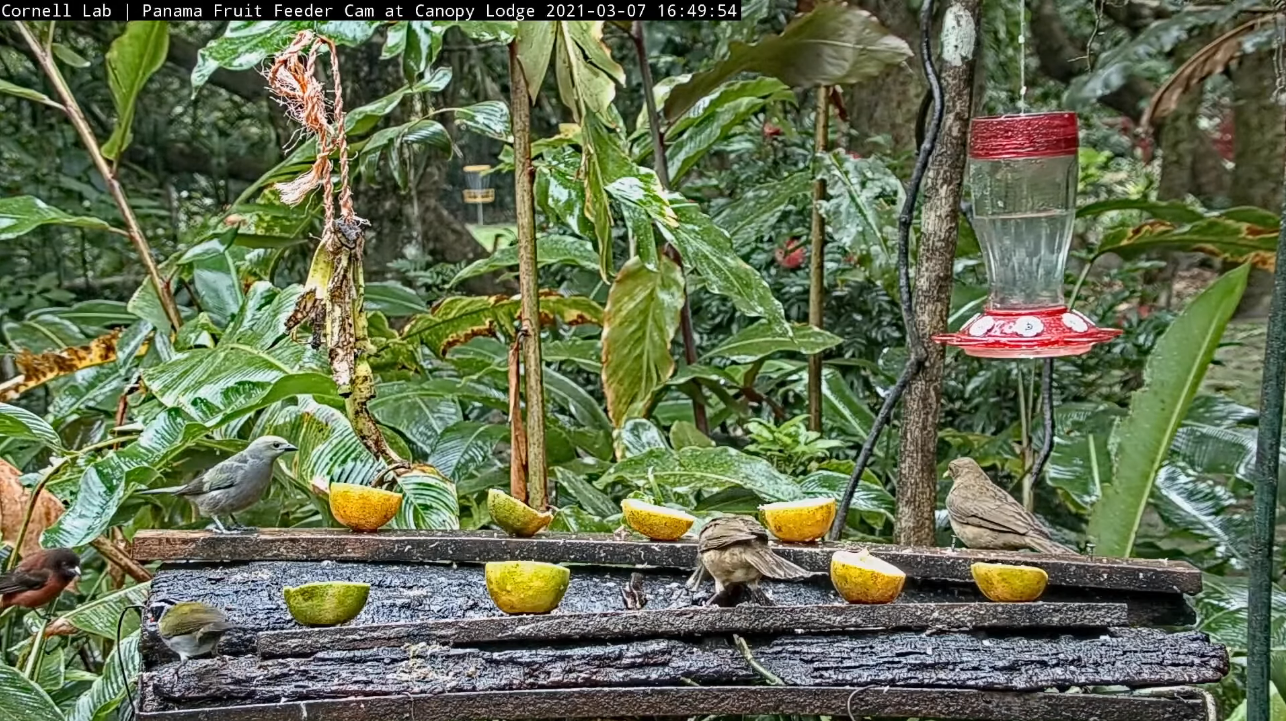
Since 2018, the Cornell Lab of Ornithology’s Panama Fruit Feeder cam has given viewers a window into the world of tropical bird species by featuring a feeding table located at the Canopy Lodge in El Valle de Antón, Panama. This unique cam has sparked conversations and curiosity about the birds and their behavior at the feeding table.
Last year, the Bird Cams Lab community came together to learn more about these birds in an investigation called Panama Live. We looked into how six species visited the cam throughout the day and how this related to food being restocked every two hours on average. In developing the research questions for Panama Live, discussions about the aggression between species came up several times. These Panama Live discussions echoed the discussions among data collectors who participated in the first Battling Birds investigation with the Cornell FeederWatch cam.
To help us figure out what was happening at the Panama Fruit Feeders, we invited a Cornell Lab researcher who has studied aggression between birds at feeders before: Dr. Eliot Miller. He had worked with Project FeederWatch participants to document aggression between birds at North American feeders and created what is known as a pecking order or “dominance hierarchy” for 136 species across North America. A dominance hierarchy can give insights into species’ ability to access resources as well as where species are distributed across the landscape (Miller et al. 2017).
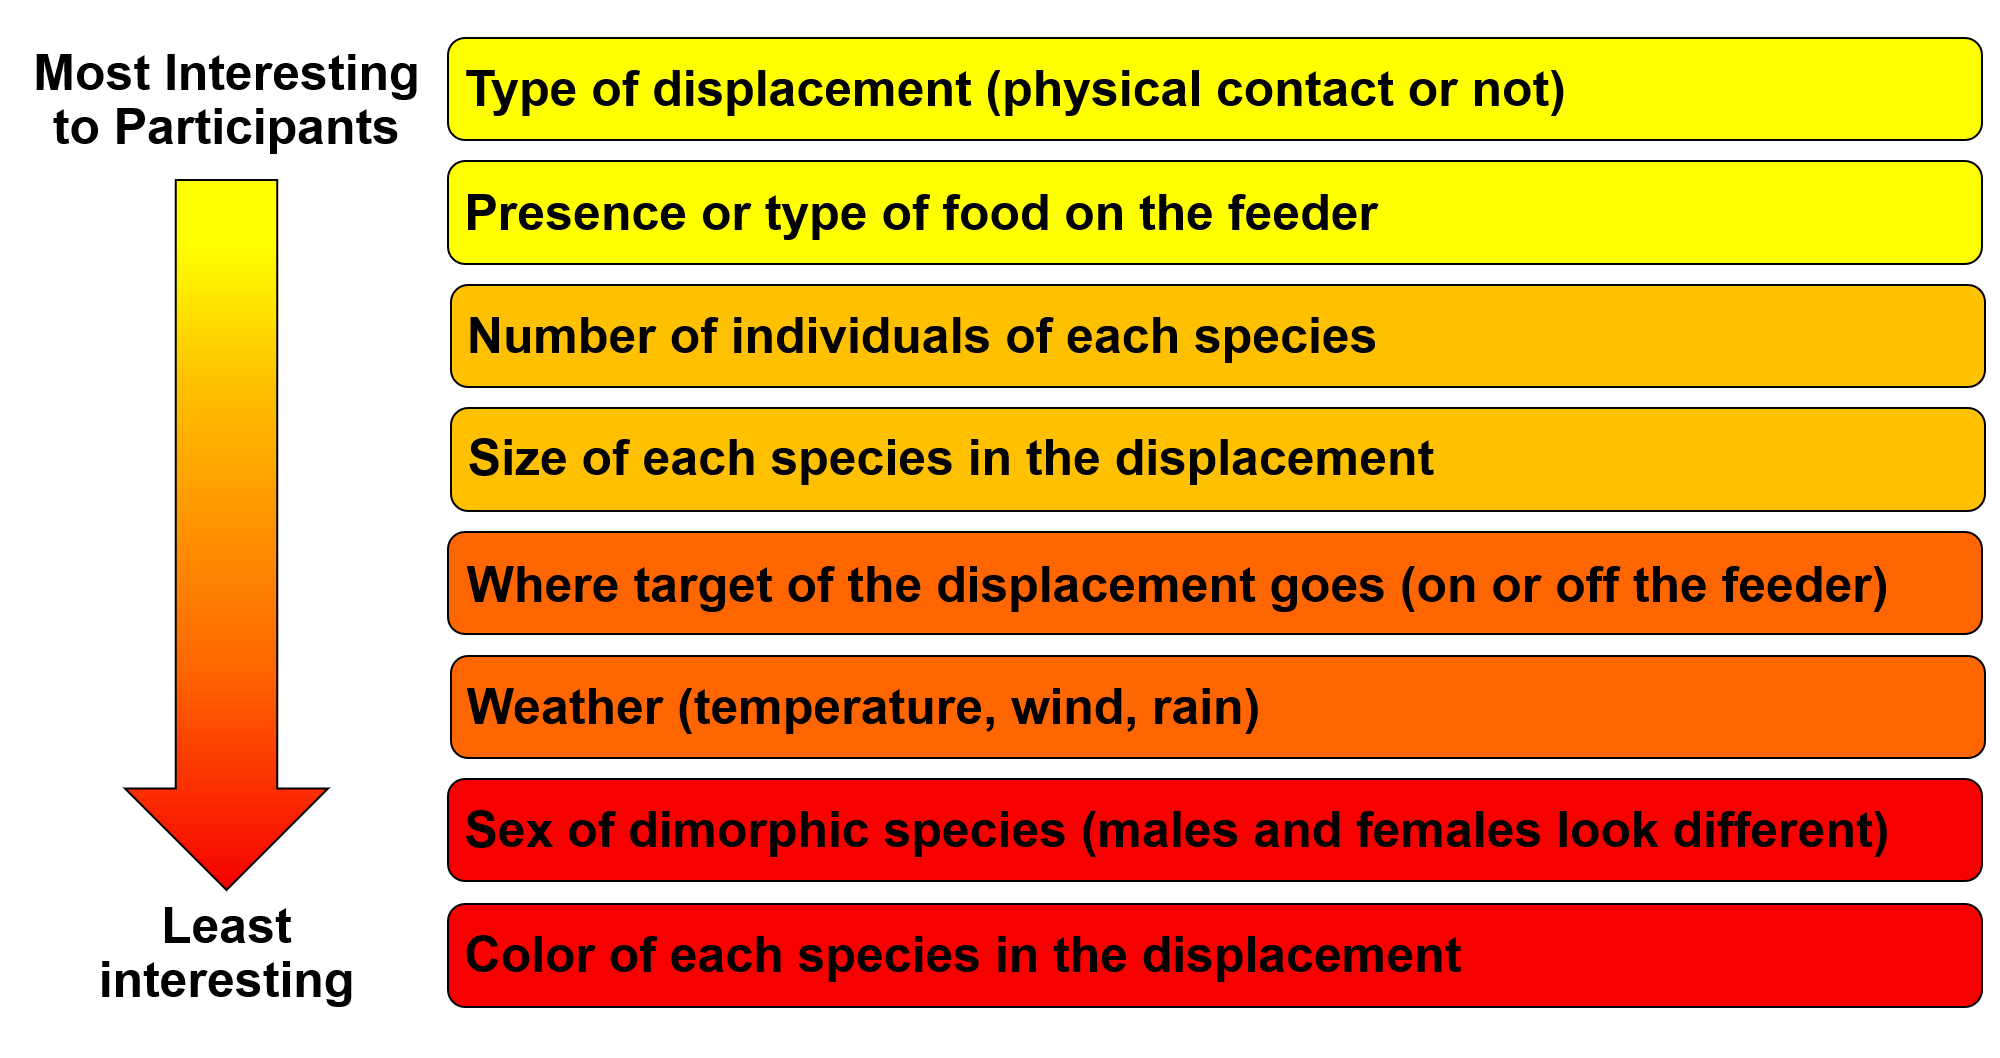
In November, the Bird Cams Lab community, Bird Cams staff, and Dr. Miller came together in an online forum and a live webinar to talk about refining the research question, what data we would collect, and how we would collect it. The community suggested great questions and important factors to consider as we developed the investigation. In the end, we set out to document one of the most recognizable aggressive interactions: displacements. A displacement occurs when one bird attempts to take the perch or food of another bird. Additionally, after taking a vote, we decided to also record information about four potentially important factors: type of food available, number of individuals present, whether physical contact is made in the displacement, and the size of the species involved in the displacement.
Methods
Based on the community discussions and final vote, the Bird Cams staff created a data collection protocol on Zooniverse. Zooniverse is an online platform that hosts thousands of projects in which volunteers from around the world can participate in scientific research. Before we began the official data collection, over 100 tested the protocol, revealing what worked, what didn’t, and what was missing from the supports and workflow.
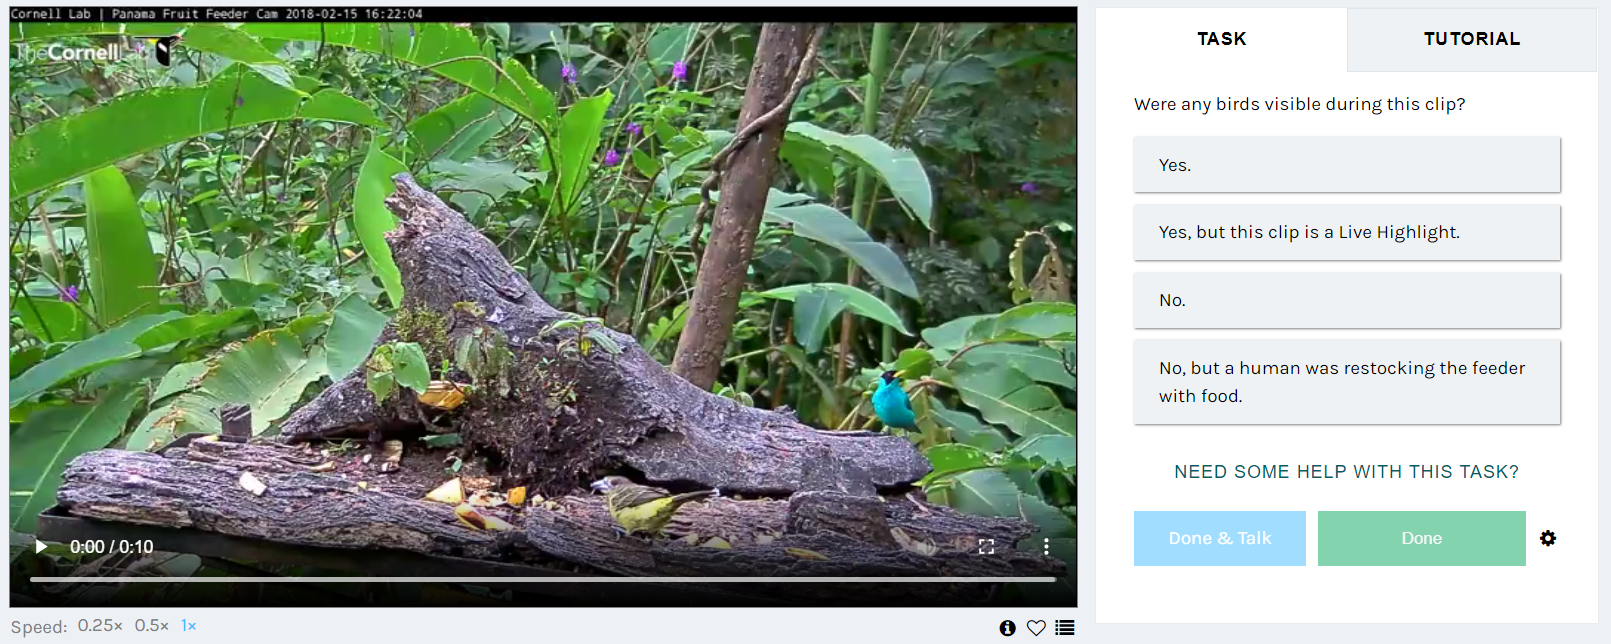
Once the final data collection protocol was developed, more than 1,300 people made 135,160 observations on 18,218 video clips from January 27 to February 17 (a week ahead of schedule!). The 10-second video clips had been cut from footage randomly selected in 2018 and 2020, and were shown in random order to data collectors. A clip was finished or “retired,” if three data collectors marked that there were no birds visible. Otherwise, each clip was watched and evaluated by 10 data collectors.
As the community collected data, they also connected with each other in the Talk forums: 270 people shared their thoughts, asked questions, gave feedback, and helped each other identify species or behaviors. For example, three people shared their observations on how the Clay-colored Thrush seemed to be involved in most displacements (which turned out to be true when we visualized the data).
During the data collection, several participants shared ideas that could be turned into future investigations. For example, several people were interested in documenting the number of individuals and species when there was no displacement. Understanding what happens when there is no displacement would allow us to see what influences the occurrence of a displacement and which birds are the most or least aggressive (taking into account how common they are).
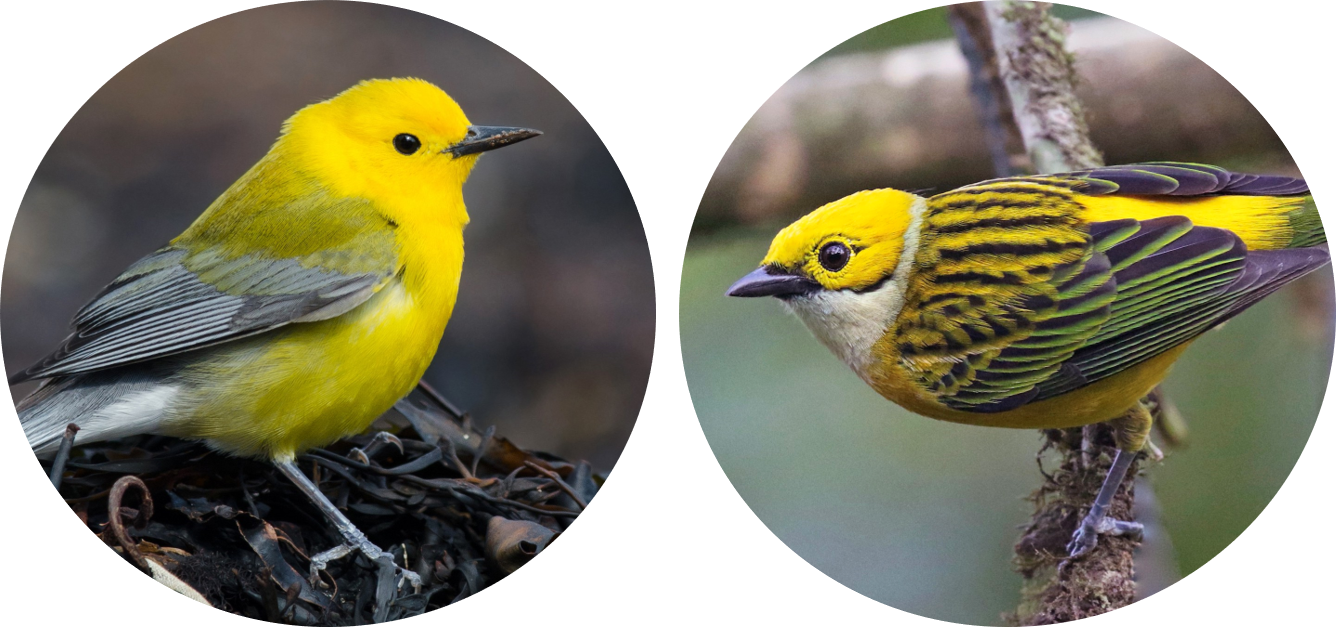
During data collection, the community also posted on the Talk forum whenever they observed displacements involving species that were not included in the data collection form (Silver-throated Tanager and Prothonotary Warbler) so that we could include them in the final dominance hierarchy.
After the data collection ended, Bird Cams staff worked with volunteer programmer Peter Mason to extract and decipher the data (read more about how we worked with the data). Next, the staff turned the data into interactive visualizations for the community to explore, and Dr. Miller ran a model analysis using successful displacements between different bird species recorded by data collectors (Miller et al. 2017). The model assessed the relationship of dominance score with body mass while accounting for the phylogenetic relationships among species. Dr. Miller also paired the dominance score of each species with its mass so we could visually explore the relationship between dominance ranking and size.
Results and Discussion
We explored the model results and data visualizations in online forums and in a live webinar. More than 340 people viewed the online data visualizations and more than 230 people attended the live session or watched the recording afterwards.
We found that birds were visible in just over half (62%) of the clips, and that of these clips 11% also had at least one displacement. In total, there were 1,367 displacements recorded, with 333 displacements between different species, most (96%) of which were successful.
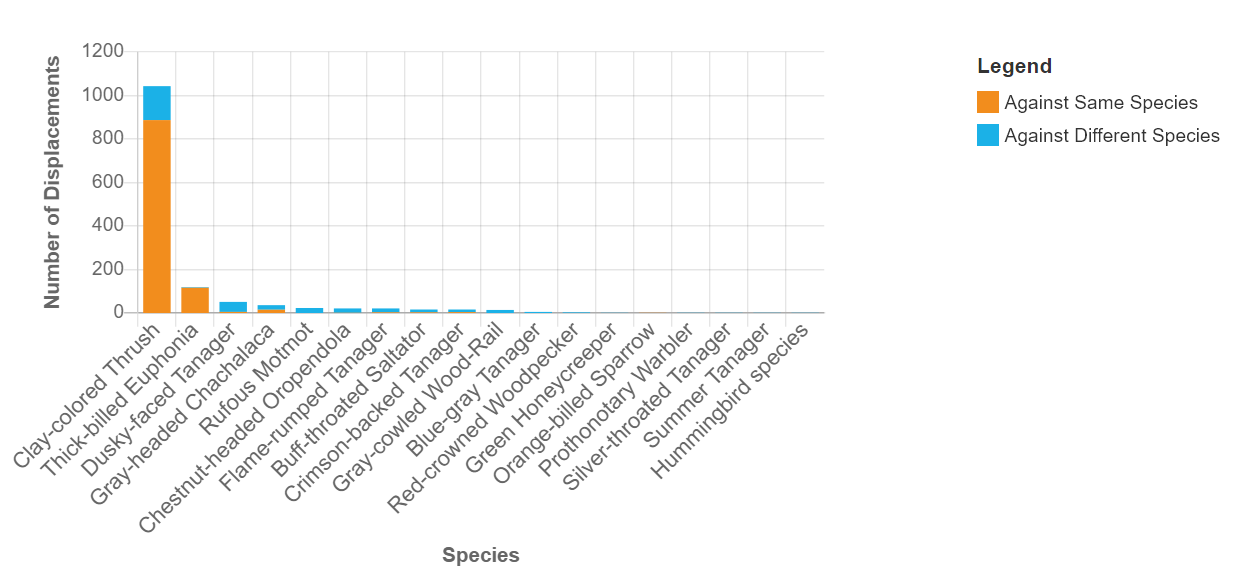
Some species initiated or were targets in more displacements than others. Interestingly, as participant Susan Nelson points out, the Clay-colored Thrush initiated more displacements against its own species than other species (Figure 5). Thick-billed Euphonias also initiated more displacements against their own species than other species in contrast to the other species (Figure 5).
When we looked at the successful displacements between different species, the Clay-colored Thrush initiated the most displacements and was the target of the many displacements by other species (Figure 6). The Thick-billed Euphonia was also the target of many displacements, but did not successfully displace other species besides the Prothonotary Warbler (Figure 6).
Two species initiated the most displacements
Species were initiators or targets of displacements at different rates
We also found that displacements mostly happened when there was food present on the feeding table and physical contact does not seem to lead to more successful displacements, confirming what participant Kaliopi Nikitas noticed during data collection.
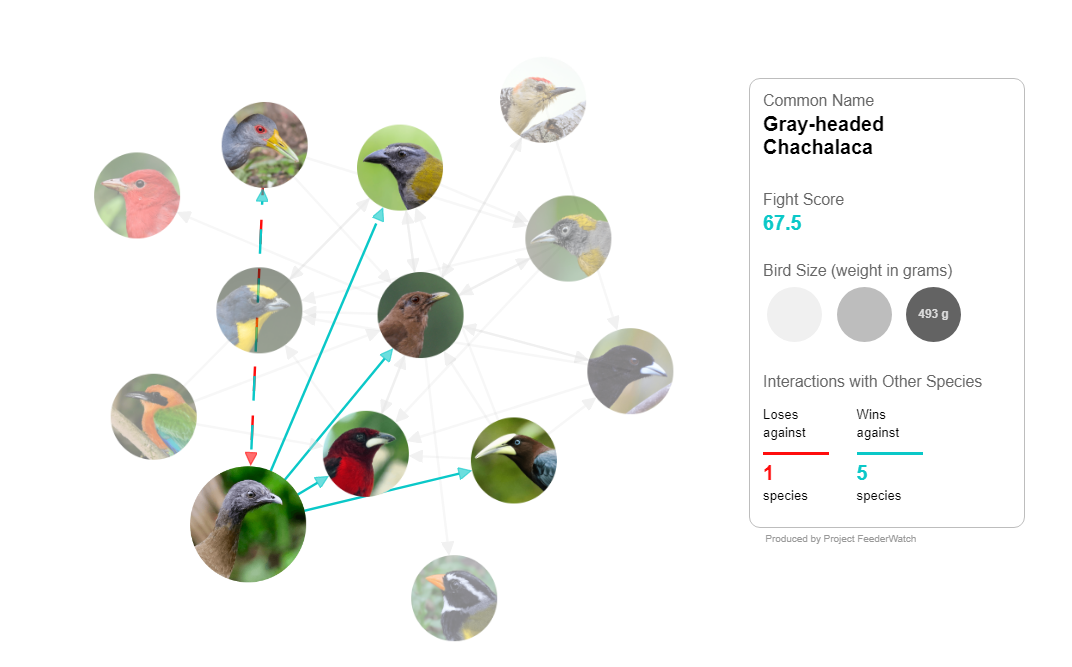
Based on the model analyses using successful displacements between different species, we were able to assign a dominance score to 20 species and create a dominance hierarchy with the Gray-headed Chachalaca at the top and Prothonotary Warbler at the bottom. The dominance hierarchy tells us which species are more or less likely to win in interactions with other species. The hierarchy was linear (species A > B > C), even if there were a few interactions in which lower ranked species successfully displaced higher ranked species (Figure 7).
When we visualized the relationship between dominance score and mass, we found a very strong relationship: the greater the mass, the higher the dominance score (Figure 8).
Heavier species had higher dominance scores
Figure 8. A scatterplot of the dominance score and mass of each species that initiated a successful displacement. The size of each point represents the number of successful displacements the species was involved in (initiated or received)–the more displacements the bigger the point. To the right of the scatterplot, species are listed according to their rankings, with the highest ranking species at the top and lowest ranking species at the bottom.
In the live webinar, we compared these findings to what is known about the dominance hierarchy for North American feeder birds, and found an interesting parallel. Participant Jessica Gallipeau pointed out that locals she met in Panama had a name for the Gray-headed Chachalaca in Spanish that translates to “Tree Turkey.” In the dominance hierarchy Dr. Miller and collaborators created for birds at North American feeders, they found that the Wild Turkey was at the top. Even though the Wild Turkey and the Gray-headed Chachalaca are not closely related, it was an interesting parallel to draw between the species at the top of the two dominance hierarchy.
As we talked through how to interpret the results, the community discussed questions that helped clarify what a dominance hierarchy can tell us about the bird species. Dr. Miller shared that he sees the feeders as a boxing arena that allows us to observe interactions that are more rare in more natural settings. By observing the interactions at the feeders and using them to create a hierarchy, we can better understand how different species access food, and why certain species are found in some areas while others are not.
An important point that also came up during both data collection and exploration was an understanding of the relationship between dominance score and aggression. Many people in the community were curious about which birds were the most aggressive or passive species. Dr. Miller confirmed that we could find out how “aggressive” each species was by collecting more data to get a better sense of how common each species is at the feeding table. If we used the number of displacements as a proxy for aggression, we would need to figure out if a species is initiating displacements more or less than expected based on how common they are at the feeding table.
Conclusion
Our investigation into the social relationships of birds visiting the Panama Fruit Feeder cam revealed that size is important–the heavier the bird, the higher the dominance score. We also found that species interact at different rates, both between and within species.
As in most studies, participant Bonnie Stalzer puts it well: “This investigation opened up more questions to investigate.” Participants shared the questions they had, many of which could be future investigation questions: “What’s the difference between migrants and non-migrants? Does dominance score change if sex is taken into account? How does the number of individuals affect dominance scores? Mass seems to be important, but what about beak size?”
To answer these questions and confirm the dominance hierarchy, we would need to increase our sample size by documenting more interactions at this and other feeders. Doing so would allow us to explore whether the patterns we discovered reflect broader trends about the birds’ behavior and distribution across the landscape.
Acknowledgements
Thank you to everyone who participated in any or all parts of Battling Birds: watching the cam, asking questions, collecting data, exploring the data, and sharing the findings. We also thank the 14 volunteer reviewers who provided input on the final report. Battling Birds was a co-created investigation and would not have been possible without our many participants every step of the way.
Thank you as well to the Cornell Lab’s Web Communications team for designing the live data tagging tool and online collaboration spaces needed for this project.
This project was funded by the National Science Foundation grant 1713225. Any opinions, findings, and conclusions or recommendations expressed in this material are those of the author(s) and do not necessarily reflect the views of the National Science Foundation.
References
Miller, E.T., D.N. Bonter, C. Eldermire, B.G. Freeman, E.I. Greig, L.J. Harmon, C. Lisle, and W.M. Hochachka. 2017. Fighting over food unites the birds of North America in a continental dominance hierarchy. Behavioral Ecology. doi:10.1093/beheco/arx108