Deciphering the Battling Birds: Panama Data
March 22, 2021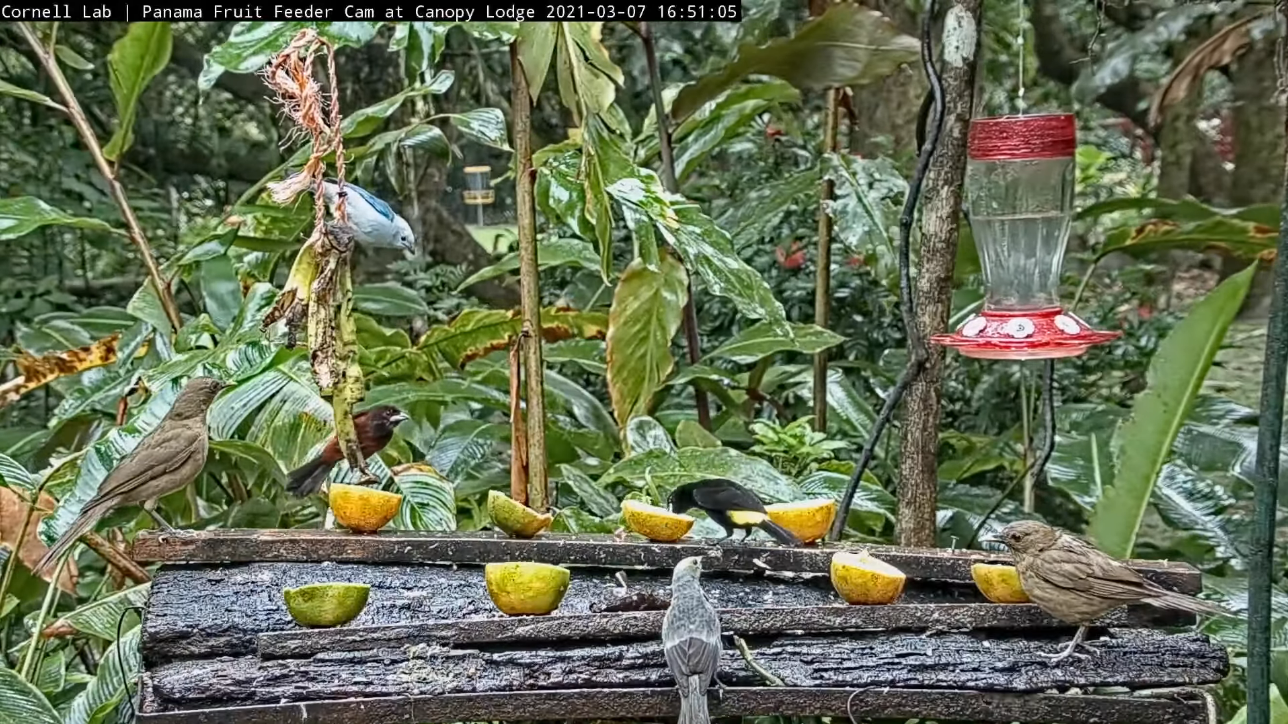
The Cornell Lab of Ornithology’s Panama Fruit Feeder cam gives us a window into the tropical forests of Panama and the birds that reside there. While many of the species seen on the cam are well known (and colorful), there isn’t much known about how these birds relate to each other in the context of a birdfeeder.
Back in November 2020, people watching the cam teamed up with Cornell Lab researcher Dr. Eliot Miller to co-create a scientific investigation to find out how birds battle it out on the cam. The investigation is called “Battling Birds: Panama Edition,” and the main goal is to understand how species interact with each other by creating a “dominance hierarchy.” To create the dominance hierarchy, we recorded when a bird attempts to take the perch or food of another bird–known as a “displacement.” Just as sports teams are ranked based on who they win or lose against, we can use the winners and losers of displacements to build the dominance hierarchy. Who’s on top? Who’s on the bottom?
Over 1,300 people collected data from 18,218 10-second clips taken from archived Panama Fruit Feeder cam footage. Multiple people watched each clip, resulting in 135,160 observations and presenting an interesting challenge we’ve come across before in past investigations: how to determine what happened in each clip?
Data collection
From January 27 to February 17, at least 1,323 people volunteered to collect data. They watched 10-second video clips taken from archived video footage of the Panama Fruit Feeder cam on Zooniverse, a free and easy-to-use platform that hosts hundreds of citizen science projects. In addition to recording displacements (when one bird attempts to take the perch or food of another bird), people also recorded data that the community had decided was important to also collect: type of food available, number of individuals present and whether physical contact was made during the displacement. The community also was interested in the effect of size on the dominance hierarchy, but that is data Dr. Miller already has and the community did not need to collect it.
The Bird Cams staff uploaded the 10-second video clips, created a data collection protocol, and supports (such as a Field Guide) in Zooniverse. For just under a week, the community tested the data collection process and provided feedback, which the Bird Cams staff used to improve the tool before official data collection launched on January 27.
The community then came together to collect data and share thoughts with each other and scientists on the Talk Boards. There they shared their observations, asked questions, and continued to give valuable feedback regarding the data collection process. By February 17, the project reached 100% completion.
How to interpret multiple observations made for a single clip?
The more people that watch a clip, the more accurate the data can become, but it can be a challenge to work with multiple answers. Each clip in Battling Birds: Panama Edition was watched 3-10 times before being completed. If 3 people watched a clip and recorded that there were no birds, the clip was considered complete; otherwise 10 people needed to watch the clip and classify what they saw.
With the help of Zooniverse volunteer and programmer Peter Mason, we figured out a methodology to distill multiple classifications for each clip down to one observation. People watching the clips sometimes agreed with what they saw, but other times didn’t and we needed to figure out what actually happened when there was disagreement. For example, let’s say that 10 people watched a clip and 9 people saw birds in the clip but one person didn’t see the birds. So, 9/10, or 90%, saw birds and 1/10, or 10%, did not see birds. For each possible answer that participants collected data for, we calculated these proportions, which are called “vote fractions.”
Once we calculated these vote fractions we used a 60% threshold to determine what actually happened in each clip. For example, if 7 out of 10 participants (70%) classified that a clip had a displacement, then we consider the clip to have a displacement. If instead only 5 out of 10 participants (50%) classified that a clip had a displacement and the other 5 participants classified that clip as only having birds, then we are not sure if there was a displacement.
We also used another technique to help make sense of conflicting observations called the “upper-median” to resolve instances when less than 60% of participants agreed on the total number of species, individual birds, and displacements in a clip. For example, if 50% of participants classified there being 2 displacements and the other 50% classified there being 1 displacement, we combine the vote fraction from the highest count downward until we reach 50%, or the median. Instead of resolving this as “unsure” we can conclude that 100% of participants agree that at least 1 displacement happened.
Next step: Visualize the data
After cleaning and distilling the data collected on Zooniverse such that there was one observation per video clip, we summarized the data using static and interactive visualizations. Summarizing the data in multiple different ways gives us the chance to explore and interpret the data together.
We invite and encourage everyone to explore the interactive visualizations and share your thoughts or questions in the forums below each visualization. Your interpretations and conversations are an important part of summarizing preliminary findings in the final report for Battling Birds: Panama Edition.