Dig Into The Data From Battling Birds: Panama
March 23, 2021Explore the data collected by over 1,000 volunteers.
Thanks again to everyone who collected data for Battling Birds: Panama Edition. Since the end of data collection in February, we’ve been working with volunteer programmer Peter Mason to extract the data from Zooniverse and analyze what your observations mean. To learn more about the data extraction process, see our Deciphering Zooniverse Data post that explains how we sifted through the 135,160 observations.
The Battling Birds: Panama Edition investigation was designed to explore the social dominance relationships of each species and create what is known as a “dominance hierarchy” that shows how each species relates to others. Over 1300 observers on Zooniverse watched short video clips from the Panama Fruit Feeder cam and recorded a dominance behavior called a “displacement,” which occurs whenever a bird attempts to take the perch or food of another bird.
Before we dig into the dominance hierarchy, and what it means, we invite you, the community, to take a look at the data and share your interpretations, questions, and thoughts.
Birds were visible in most video clips
Out of the 18,218 video clips, 62% had at least one bird visible while 37% did not. Only 137 or 1% of video clips were categorized as “unsure” (i.e., less than 60% of people watching the clips did not agree on whether birds were visible or not). This disagreement was most likely due to birds being hard to notice as they flew in and out of view or hopped behind vegetation.

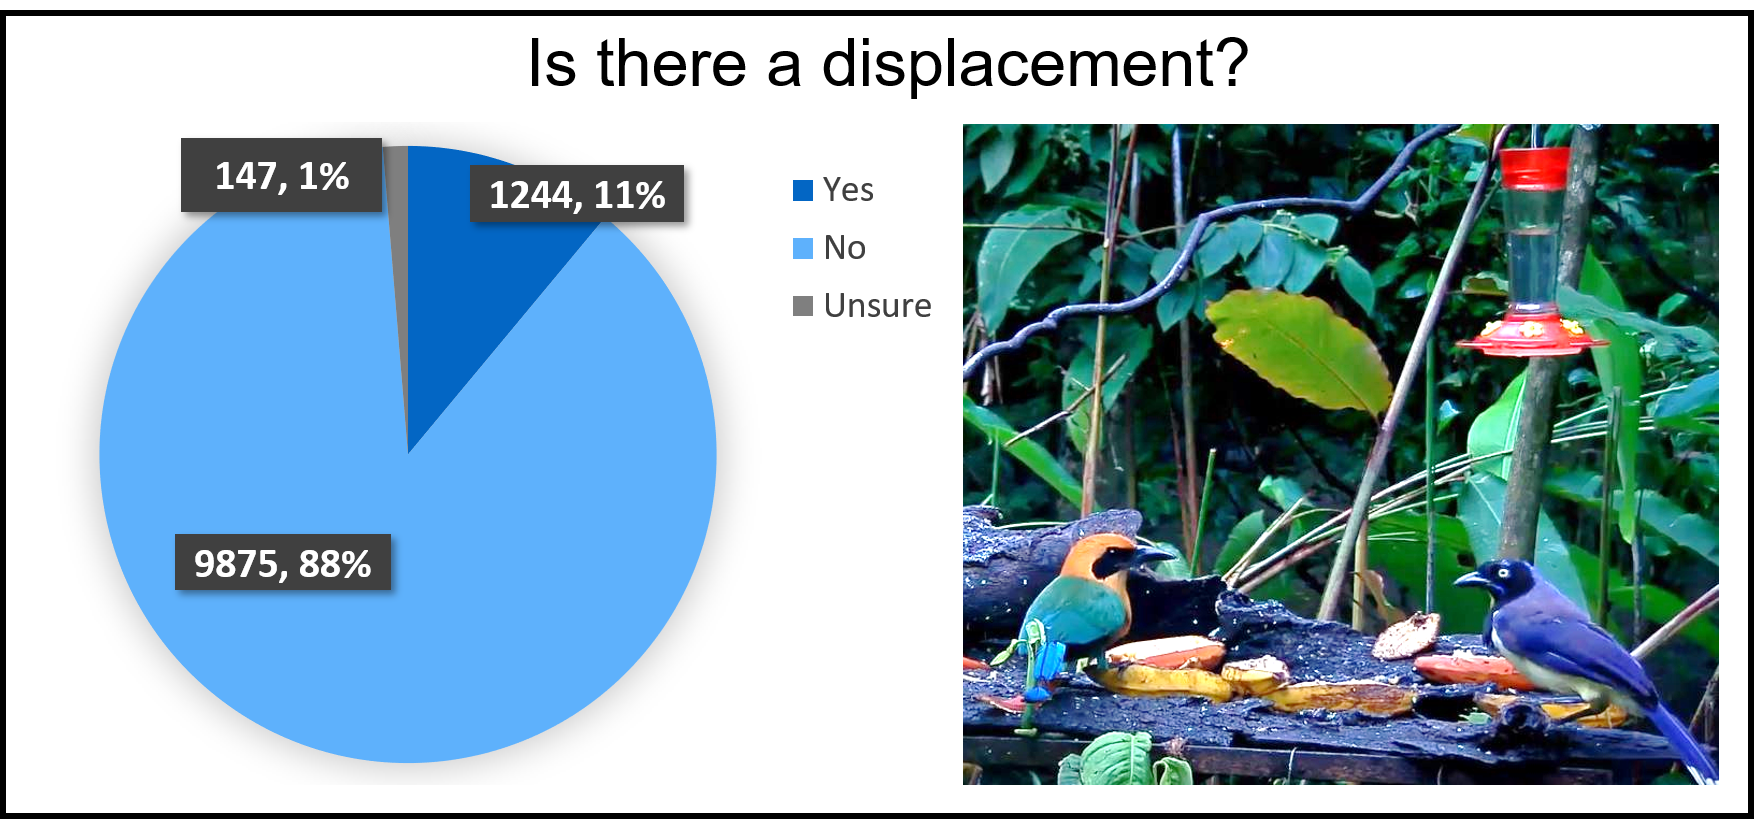
Most video clips with birds did not have a displacement
Out of the 11,266 clips in which birds were visible, only 11% had at least one displacement (i.e., when one bird attempts to take the perch or food of another bird). Like any behavioral research, even though we chose one of the more straightforward interactions to document, there was still disagreement at times about what was happening. This is okay, because even professionally trained scientists may not always agree when collecting data.
Want to explore more?
We’ve created interactive visualizations for us all to explore together. In these visualizations you can click on and off data sets to see how the frequency of displacements varied within and across days as well as between different species.
Check out the interactive visualizations and let us know if you are interested in any additional visualizations!