Votes Are In and Data Collection Starts Soon

March 19, 2021

749 people weighed in on what we should collect for the Cornell Feeders Live investigation

A red-bellied woodpecker (white and black bird with a red head), blue jay (blue and white bird), and male northern cardinal (red bird), perch on feeders seen on the Cornell FeederWatch cam. The back drop is sunny snow and vegetation that is leafless.Three species we will study in the Cornell Feeders Live investigation, Red-bellied Woodpecker, Blue Jay, and a Northern Cardinal, visit the feeders on the Cornell FeederWatch cam.

The Results

In the past month, Bird Cams Lab participants shared what they want to learn more about and discussed questions we could potentially investigate with the Cornell FeederWatch cam. In the most recent set of discussions on the Question Design Board, two questions rose to the top with the most upvotes and were refined further:

  1. What is the daily visitation pattern of different species at the feeders?
  2. How does weather affect the probability of different species visiting the feeders?

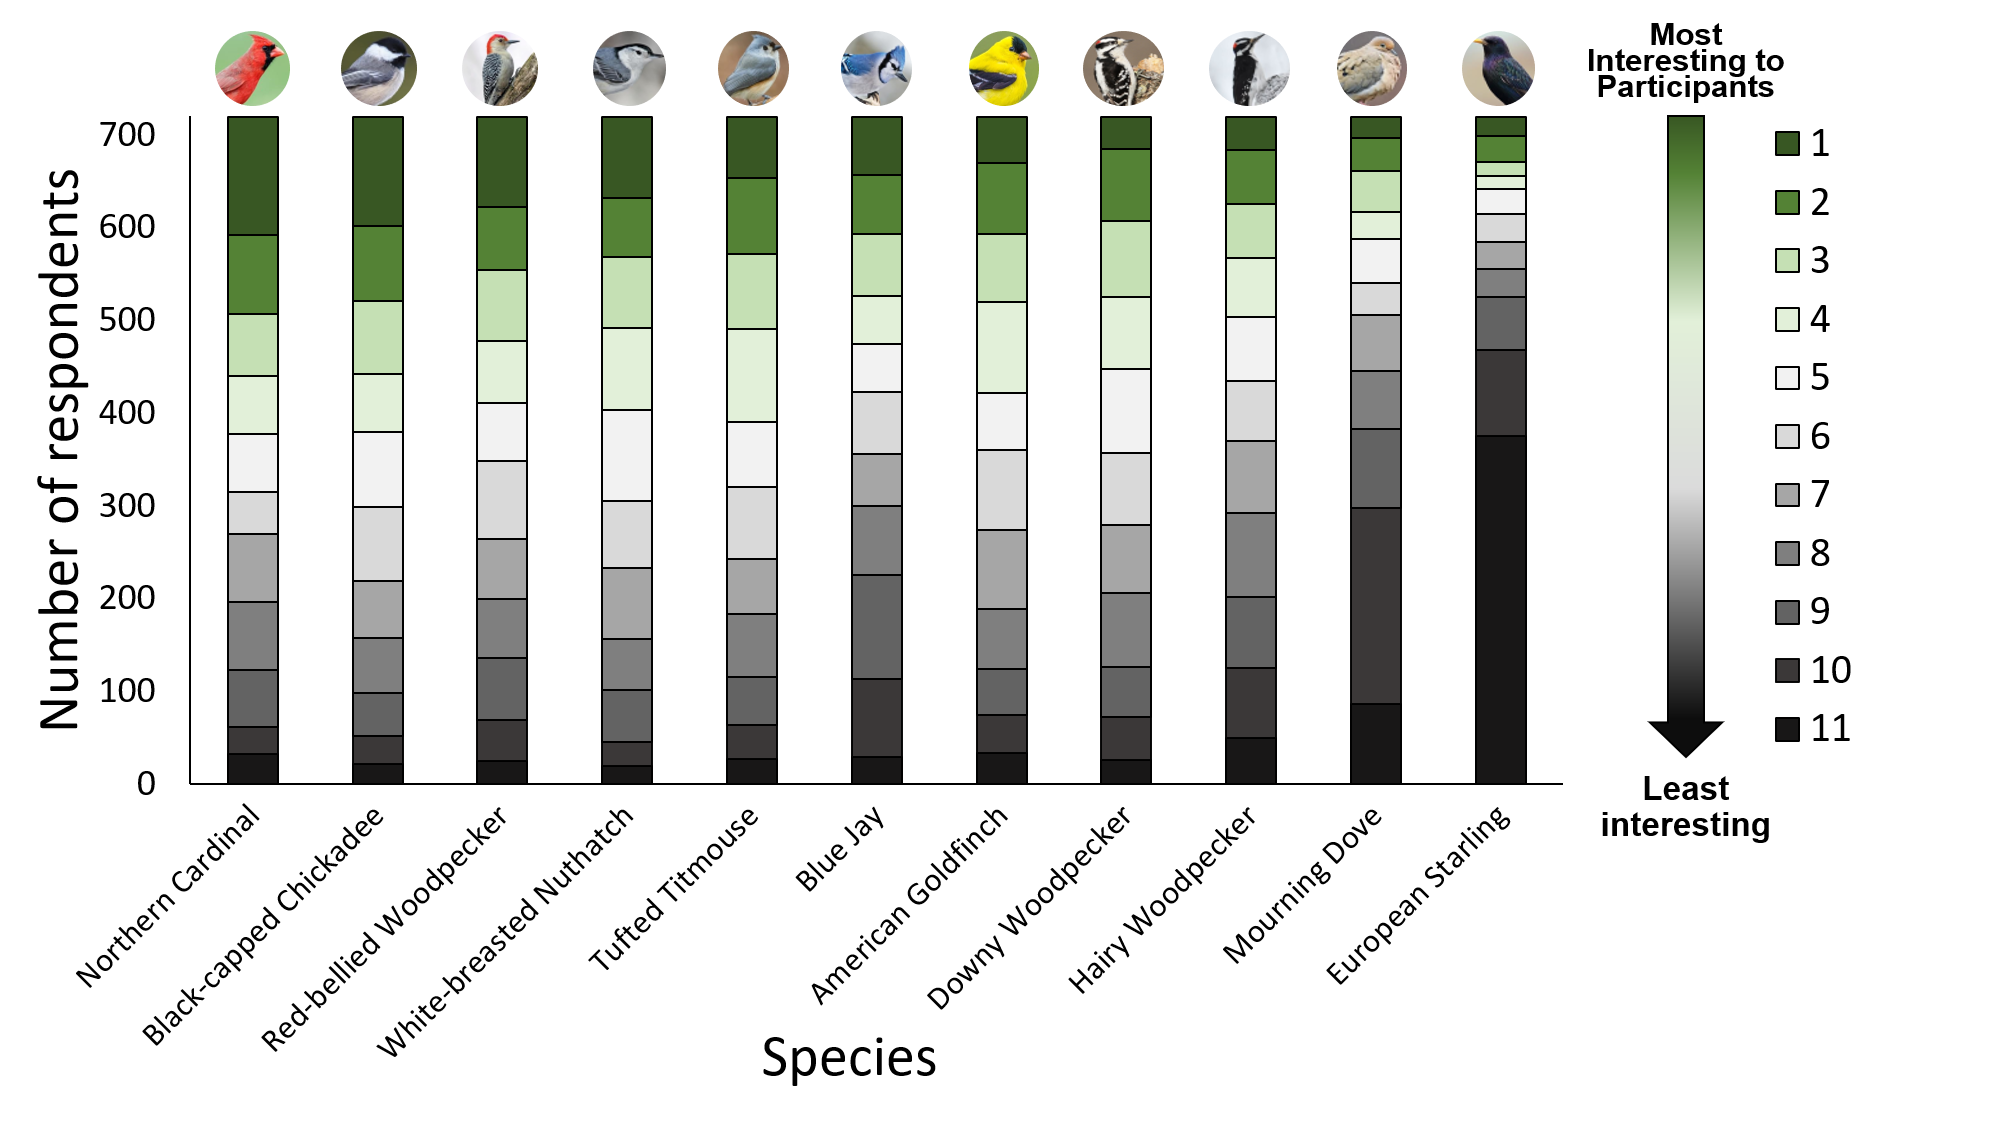
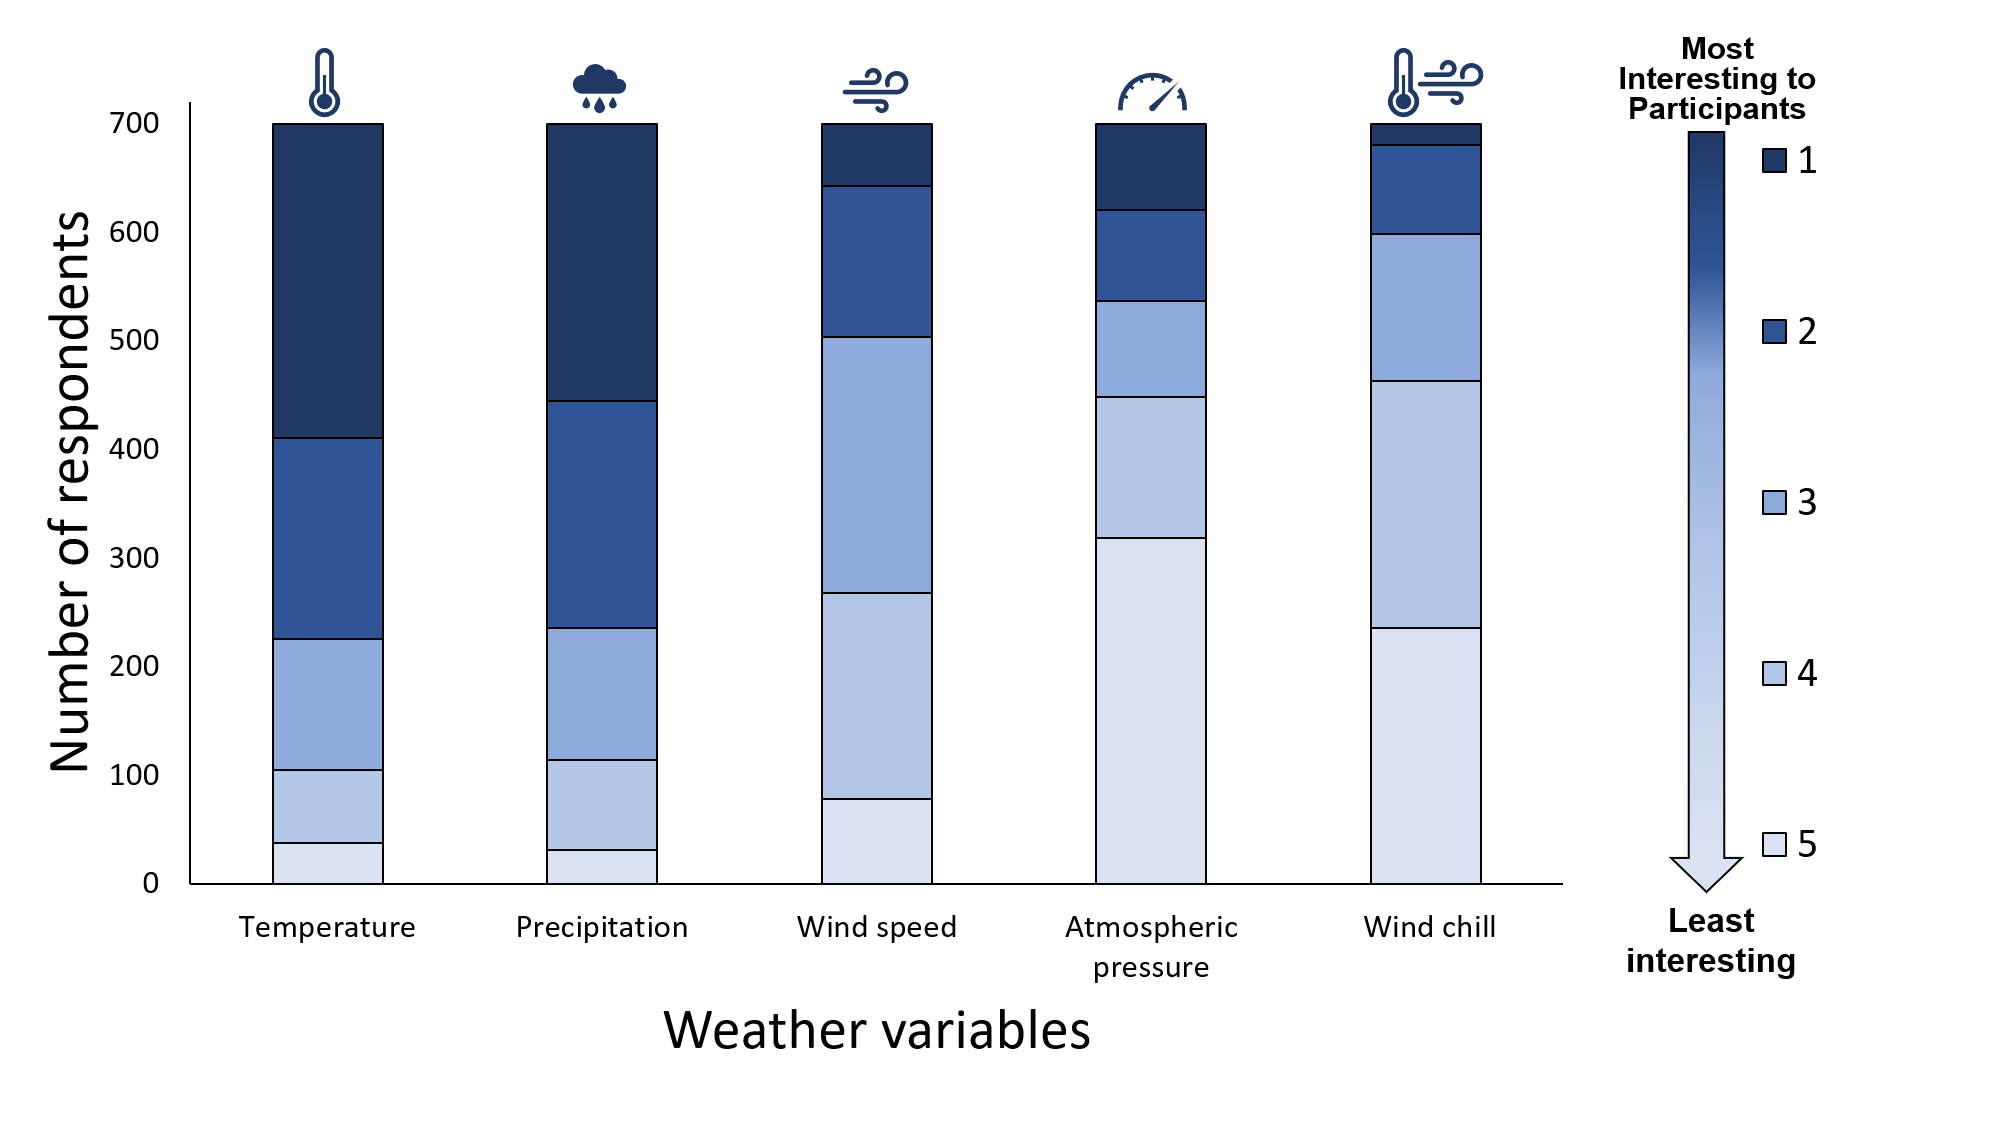
Then, 749 people ranked eleven species and five weather variables, helping narrow down what data we’d collect both in real time on the cam and gather afterwards from the nearest weather station. We have eight buttons that we can customize to collect data in real time on when species arrive at the feeder.

Based on the rankings, we’ll collect data on seven species with the highest rankings: Northern Cardinal, Black-capped Chickadee, Red-bellied Woodpecker, White-breasted Nuthatch, Tufted Titmouse, Blue Jay, and American Goldfinch (Figure 1).  Additionally, we’ll be collecting data on the Red-Winged Blackbird, a species that can be a short-distant migrant and just arrived back at the feeders. At this time of year, Red-Winged Blackbirds are not only frequent visitors, but relatively easy to identify as well. 

Figure 1. A stacked bar chart in which eleven species that were available for ranking by interest are on the horizontal axis. The vertical axis corresponds to the number of respondents who chose each ranking for each species. The bars transition in color from dark green to black, with the gradient illustrating most interesting (dark green, 1) to least interesting (black, 5). Photo credits: Northern Cardinal by Alix d’Entremont/Macaulay Library; Black-capped Chickadee by Scott Martin/Macaulay Library; Red-bellied Woodpecker by Carl Geometti/Macaulay Library; White-breasted Nuthatch by Ryan Schain/Macaulay Library; Tufted Titmouse by Ben McGann/Macaulay Library; Blue Jay by bellemare celine/Macaulay Library; American Goldfinch by Adam Jackson /Macaulay Library; Downy Woodpecker by Evan Lipton/Macaulay Library; Hairy Woodpecker by Nate Brown/Macaulay Library; Mourning Dove by Ryan Schain/Macaulay Library; European Starling by Dan Vickers/Macaulay Library.


Three male red-winged blackbirds feed on the platform on the Cornell FeederWatch cam against a snowy backdrop. The birds are all black except for a small patch of red and yellow on their wing-shoulder.Three Red-winged Blackbirds feed on the FeederWatch cam.

We’ll also gather precipitation and temperature data from the nearest weather station as they were the variables with the top rankings (Figure 2).

A stacked bar chart with weather variables on the horizontal axis and the number of respondents on the vertical axis. The weather variables from left to right are temperature, precipitation, wind speed, atmospheric pressure, wind chill. Above each bar is a symbol corresponding to each variable. To the right of all the stacked bars is a legend with an arrow pointing down and showing a gradient from dark blue to light blue. The dark blue correspond to the highest ranking and the light blue to the lowest ranking. Temperature and Precipitation are the highest ranked.Figure 2. A stacked bar chart in which five weather variables that were available for ranking by interest are on the horizontal axis. The vertical axis corresponds to the number of respondents who chose each ranking for each weather variable. The bars transition in color from dark blue to light blue, with the gradient illustrating most interesting (dark blue, 1) to least interesting (light blue, 5).

What’s next?

The Bird Cams Lab team is modifying the live data tagging tool to reflect the species we want to collect data on for the investigation (we’ll be gathering the weather data afterwards). They are also creating a field guide and a tutorial to make sure that everyone, regardless of prior knowledge or experience, will be able to successfully collect data. We hope to start collecting data within one to two weeks. 

Can’t wait to get started?

Have a question, thought, or comment? Share below.