The Data Tool: Live Tagging
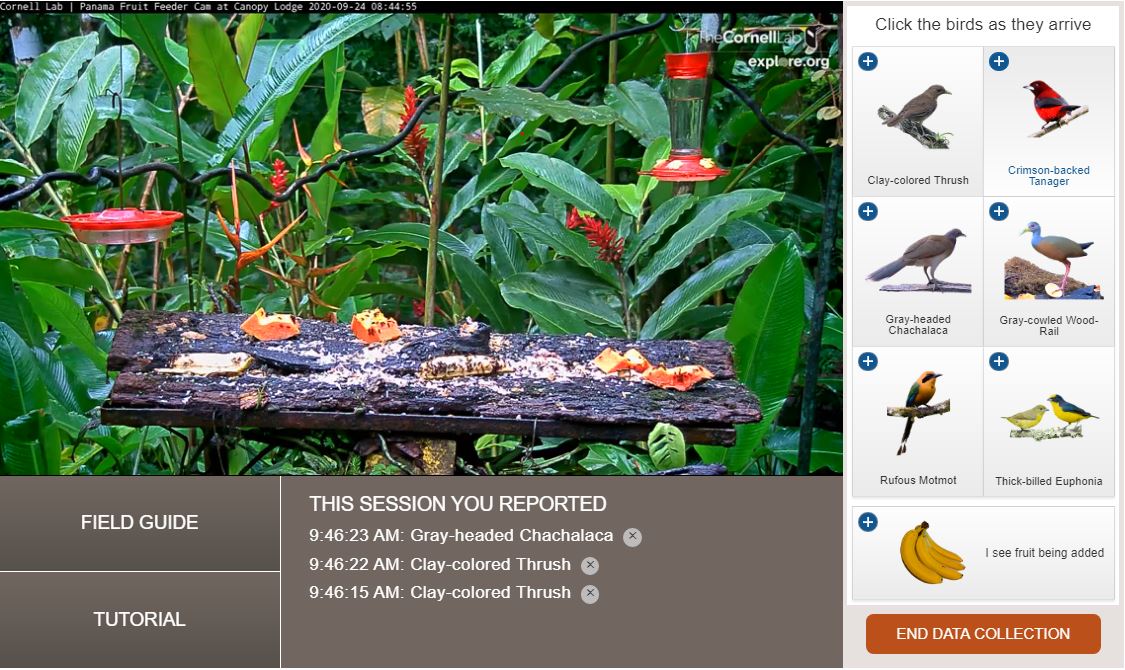
February 12, 2021For the Cornell Feeders Live investigation, we’ll be using a recently developed live data tagging tool. We first used this tool for Panama Live. In that investigation we documented the arrival patterns of six species on the Panama Fruit Feeder cam.
When brainstorming questions in the “Wonder” Board, let your curiosity run wild and post whatever questions that pop into your head. As the community starts to narrow down and evaluate which questions we could realistically investigate based on what’s observable on the Cornell FeederWatch cam, refer to this post that helps explore what might or might not be “cam-testable.”
Keep in mind that collecting data in a live environment can be challenging! Things can happen very quickly at the feeder, and we will not have the ability to rewind and watch something again.
The data that we collect needs to be relatively simple, easy, and able to be captured with the click of a button. Early user testing suggests that anything that takes more than a click can distract from what’s happening on cam, and make it difficult to make sure that important moments aren’t missed.
To better understand how the live data tagging tool works, watch a short video tutorial on how we collected data for Panama Live.
Use this information as a guiding post when taking part in the discussion on the Wonder Board. Knowing what tool we have at our disposal is important when figuring out how we will ask our research question and what data we need to collect in order to answer it.