Changing Vocalizations
January 22, 2020Last week we found out that when nestling were vocalizing, they were also primarily being fed or the adult was brooding. This week, we’ll dig deeper into both nestling and adult vocalizations to see if and how they change over time.
Click here to see the interactive version of this graph.
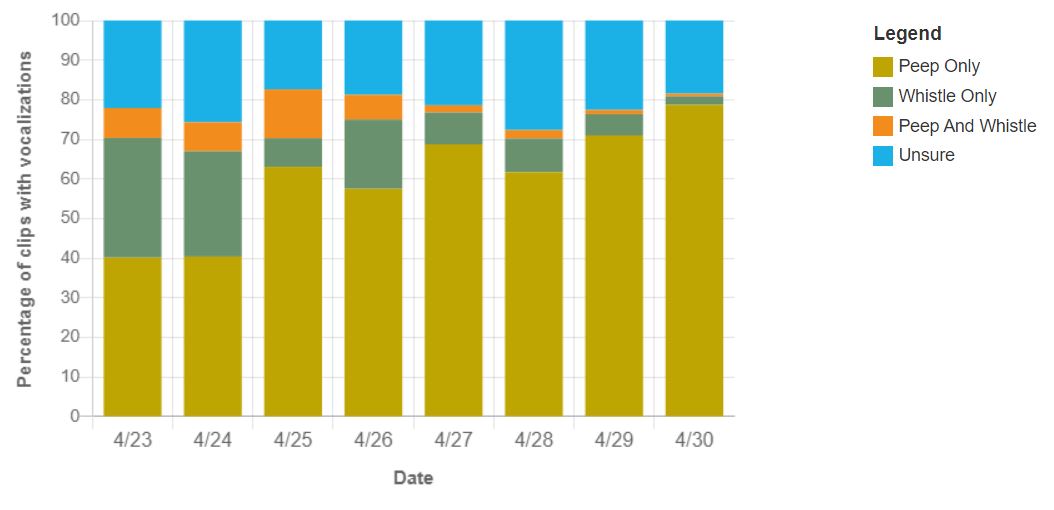
In the chart above we focus in on how the types of different nestling vocalizations shift with time. Date advances along the horizontal axis and the percentage of clips for each vocalization type is along the vertical axis. This percentage is calculated out of the clips that had some sort of nestling vocalization. For example, on 04/23, 40% of clips with a nestling vocalization had peep only vocalizations in them.
You might notice that the height of the different colored bars changes as the date progresses from 04/23 to 04/30. As the nestlings get older, they seem to whistle less, with the orange and green bars decreasing in height, and to peep more, with the peep only bar increasing in height.
Do you have any ideas about why we might be seeing these patterns? Should we look at or consider something else when looking at these patterns?
Share your thoughts below and then play with an interactive version of this chart here.