Engaging the Public in Collecting Data from Live and Recorded Wildlife Cams: Tips for Project Managers
August 24, 2021During 2018–21, Bird Cams Lab enabled scientists and participants to make discoveries about birds using live streaming wildlife cams. In three investigations (Battling Birds, Hawk Talk, and Battling Birds: Panama Edition), participants collected data from archived video footage. In three other investigations (Panama Live, Hawk Happenings, Cornell Feeders Live), participants collected data in real time while observing live cams.
Here we share what we learned from gathering data from wildlife cam video footage, both live and archived, and our recommendations for project managers looking to do research with wildlife cams.
Archived Wildlife Cam Video Footage
Uploading video to Zooniverse
To gather data from recordings of our live cameras, we used the world’s largest and most popular platform for people-powered research: Zooniverse. Zooniverse allows anyone to build a research project and recruit volunteers to process images, audio, and video.
The recordings were originally archived in a variety of file types, durations, and resolutions. Because Zooniverse places a 1 MB file size constraint on individual video files uploaded to projects (referred to as “subjects” on Zooniverse), our team experimented with modifying the resolution, compression, and quality of our video subjects while retaining usefulness for gathering data. Our final settings reflected that compromise, downscaling the original videos to 480p and limiting their duration to 10–15 seconds.
We developed a methodology for automatically cutting and uploading thousands of video clips into Zooniverse. The open source code we developed to turn the recordings into 10–15 second clips is available in our BitBucket repository.
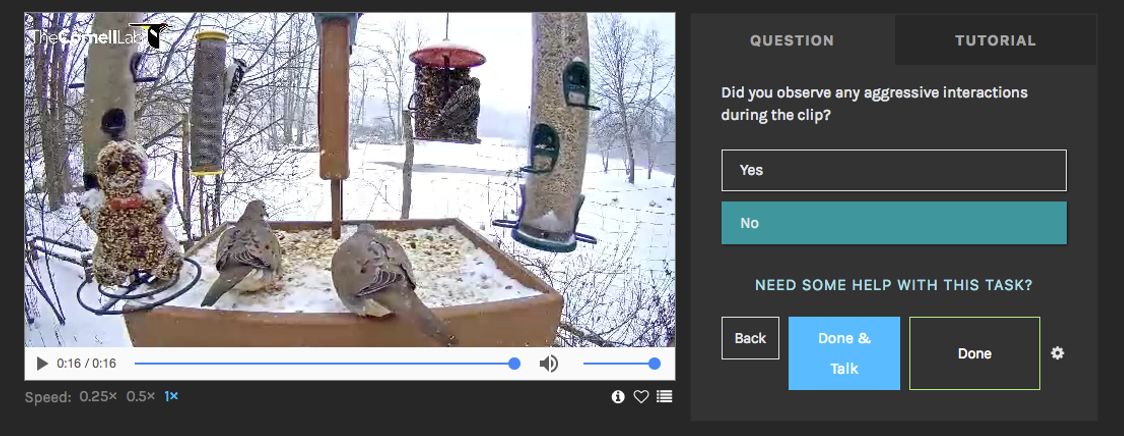
Data Annotation and Processing Archived Video
Insights we learned in designing two data classification projects using the Zooniverse platform included the following:
- Timely completion of the project is important to maintain momentum and participant interest.
- Tasks must be designed simply and classifying data should be interesting or rewarding.
- Simplicity and speed of data collection must be balanced against the need for reliable conclusions.
- If numerous data must be collected from a single video clip, consider processing sets in installments to achieve faster completion.
- Data extraction and analysis from Zooniverse required writing specialized scripts with help from a Zooniverse volunteer. The complexity of data extraction and analysis can be simplified by constructing simpler work flows.
- Training and feedback for participants may improve the speed of data collection by aiding accuracy and enabling quicker consensus, as well as enhancing user engagement and confidence.
- Email updates result in spikes of classification activity. Regular correspondence may help move projects to completion.
- To facilitate data processing and accuracy, Zooniverse enables weighting contributions of super users more heavily or creating rules to “retire” clips when specified criteria are met (e.g., when three participants agree there are no birds in a clip).
- Zooniverse enables multiple participants to classify data for each video clip and retire clips when a certain number of participants have watched the clip or “consensus” is reached based on thresholds set by administrators.
Ensuring accuracy in video annotations with Zooniverse
Research on Zooniverse is made possible by millions of volunteers coming together to help researchers by collecting data from images, audio, and video. Most, if not all, project managers ensure that the data they collect are high quality by having multiple independent volunteers collect data from each “subject”—an image, audio, or video file. This practice follows one of the many recommendations by Kosmala et al. (2016) to ensure that citizen-science, community, and crowdsourced projects produce accurate data. But how many people should process the same subject, and what happens if they disagree?
Over the years, several Zooniverse projects have created methodologies to address these questions in the context of collecting data from images. For example, for Snapshot Serengeti, Swanson et al. (2016) assessed how the number of volunteers classifying each image relates to accuracy and how many volunteers are needed to achieve accuracy comparable to that of experts classifying the same images. For the same project, researchers also documented that a plurality algorithm, “certainty” metrics, and the median number can yield accurate identification of mammalian species and number of individuals in images (Swanson et al. 2015).
How these methodologies apply to video has not been well-studied, as few projects on Zooniverse have used video. However, in recent years, as more video projects have come online, methods have been developed to determine the optimal number of volunteers to classify each video clip and how to determine “consensus” for each one (Arizona BatWatch; Chimp & See, McCarthy et al. 2021).
We recommend that when gathering data from video on Zooniverse, project managers should carefully consider the number of people needed to watch each video clip (i.e., retirement count). There isn’t a “one-size-fits-all” for the number of people needed, and the most appropriate number should be investigated in the “Beta phase” before the project is made public. How many people are needed to watch each video will depend on a variety of factors including the ecological system, taxa, and difficulty of collecting the data (Swanson et al. 2016). Additionally, project managers will need to navigate the balance between data quality and public engagement. More people watching each video clip will lead to higher data quality up to a certain point, but will also take more time for the project to reach completion and may not be the best use of each participant’s time.
In addition to determining the most appropriate retirement count, project managers will need to decide the most appropriate way to reach “consensus” (i.e., agreement on what happened in the video clip). Will every person watching a video clip need to agree on what happened? Or is it okay if seven out of ten people agree? Six out of ten people? For counts, is it appropriate to use the median number reported? The average number? These are questions that every project needs to address in order to ensure that the data being collected, and the time devoted by the volunteers, doesn’t go to waste and helps to make new discoveries.
What We Did for Bird Cams Lab
To determine the best retirement limit for the Bird Cams Lab investigations, we looked at what other projects were doing, and then assessed if consensus changed with the number of people classifying a video clip. For Battling Birds (New York) and Battling Birds: Panama Edition, we used a unique retirement rule to prioritize clips that had birds in them. When three people marked that there were no birds visible, the clip was retired; otherwise the clip was classified by 10 people.
We found that when we set the consensus limit to be 0.70 (seven out of 10 people), for a subset of video clips (N=152), 93% had consensus for determining if birds were visible and if there was a displacement (when one bird takes the perch or food of another bird). For Hawk Talk, we initially set our retirement limit to 11, but then decreased it to 6 after reanalyzing the data collected during the Beta phase and finding that consensus didn’t increase after 5 people had classified a clip. This finding was similar to previous work with Arizona BatWatch, a project that revised their retirement limit to be six when they found that six volunteers were just as good as six experts in classifying video clips.
For future investigations, in addition to these efforts, we would also want to determine what the rate of accuracy and agreement is by comparing randomly sampled volunteer classifications to a group classified by “experts” to determine if the data collection protocol is working as intended (Anton et al. 2018).
Live Wildlife Cam Video Footage
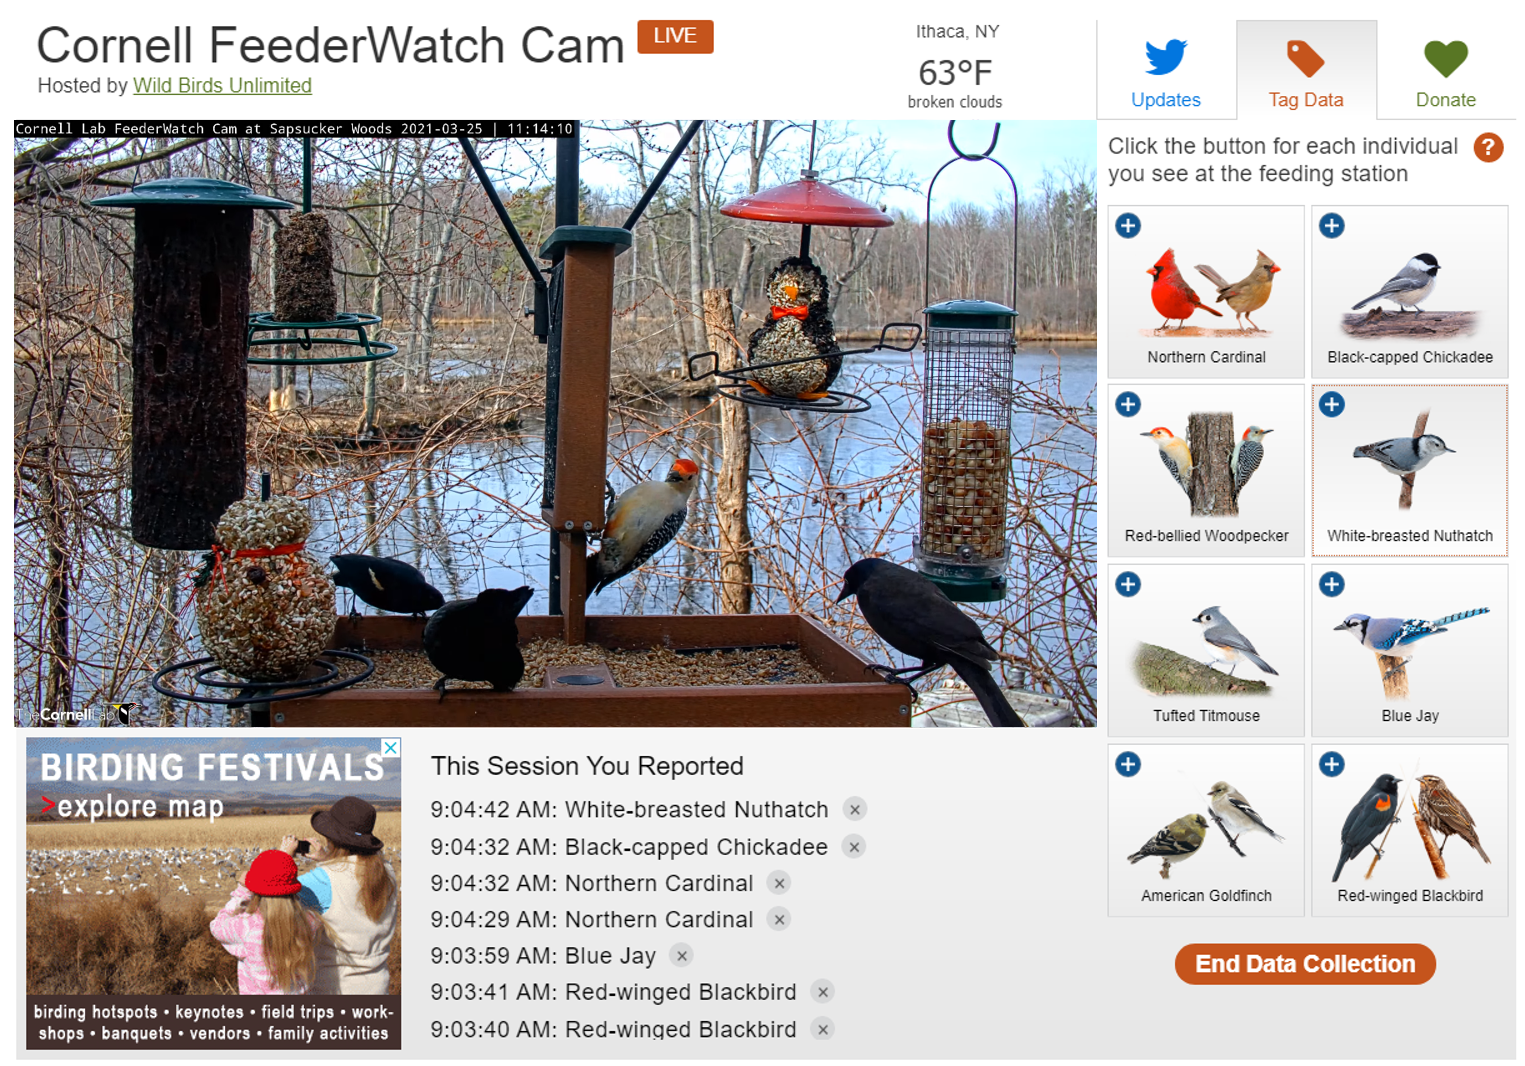
To gather data in real time from our live cameras, we created a live data tagging tool that could be used on either of our WordPress sites (Bird Cams or Bird Cams Lab). Inspired by the Snapshot tool created by explore.org, we wanted to be able to allow cam viewers to click a button and record events seen in real time on the cam. In creating this live data tagging tool, we have developed open source code that is available on our BitBucket repository.
Understanding Live Data Tagging is a New Frontier
As far as we know, Bird Cams Lab is the second project to date to test the potential of live cameras for citizen-science data collection. Schulwitz et al. (2018) first tested this idea with a cam on an American Kestrel nest box. Just like Schulwitz et al. (2018), Bird Cams Lab invited anyone watching cams to collect data, which meant that multiple people could be watching at the same time, and making repeat independent observations. This presents a unique challenge because unlike the setup to collect data from archived video clips on Zooniverse, there is not a discrete unit of time in which peoples’ observations can be compared.
Schulwitz et al. (2018) addressed this challenge of redundant independent observations by reducing identical observations within a minute to one observation for that minute. When they compared these reduced observations to those of an “expert,” they found that 88% of the reduced observations are accurate.
Another consideration with live data tagging is that there will not always be someone watching the cam and collecting data. Understanding when the cam is being watched by at least one person is critical to understanding whether the absence of data is due to no effort or nothing happening. The number of people watching and collecting data will most likely vary throughout the day, and could even be biased towards certain times of day (Schulwitz et al. 2018). This variation in effort is not a problem, but can be quantified and accounted for in statistical analyses (Kosmala et al. 2016).
What We Did for Bird Cams Lab
For the Panama Live and the Cornell Feeders Live investigations, participants clicked a button whenever they saw one of the 6–8 focal bird species visiting a feeding station. For the more commonly seen species on the cameras, this led to a flurry of observations and it was difficult to determine the most appropriate time interval to merge multiple independent observations from multiple participants.
Instead of quantifying the absolute number of visits, we decided to reduce the observations to presence or absence of the focal species for half-hour time intervals. We chose half-hour time intervals because an hour was too long to expect continuous observation by participants and shorter than a half-hour was difficult to visualize. Additionally, for exploratory visualizations we limited the dataset to be half-hour intervals for which at least 15 minutes was watched (half of the interval). While we could quantify the variation in observation time for statistical analyses, for exploratory visualization purposes we wanted the data to be comparable and not potentially driven by variation in effort.
For the Hawk Happenings investigation, participants clicked a button whenever they saw certain hawk behavioral events (ex: prey delivery, feeding). Because these events were less frequent than bird visitations to a feeder, we followed a methodology inspired by Schulwitz et al. (2018): multiple independent, identical observations that were within one minute of each other were reduced to one observation. We then were able to visualize the data and run statistical analysis to determine how the rate of prey delivery and feedings changed with variables the community was interested in (like weather).
Next Steps for Live Data Tagging
Is it appropriate to reduce multiple independent observations that are within one minute of each other? Should it be two minutes? How do we assess what actually happened when participants disagree with each other? These questions remain unanswered, and will need to be answered if project managers seek to use live data tagging to better understand the natural world.
Live Versus Archived Wildlife Cam Video Footage: Which to Choose?
When deciding whether to collect data in real time or from archived wildlife cam video footage, considerations include (1) the goals of the project, (2) what type of data are needed to answer the research questions of interest, (3) technical infrastructure, and (4) participant experience. If a project goal is to involve as many people as possible, we recommend using archived footage for data collection, especially if the events of interest occur during limited hours. Collecting data from archived video footage allows anyone to participate at any time of day, regardless of time zone or availability. Alternatively, if a goal of the project is to involve those already watching the camera, we recommend using live data tagging to engage people on the platform they are already on instead of sending them to a new platform such as Zooniverse.
With regard to the type of data able to be collected, we found that participants were able to collect data on simple, recognizable events while watching live cams, but gathering more complex behavioral data was easier using archived video footage. During live data tagging, if events happen quickly in succession, it can be more difficult to log them without missing any. When collecting data from archived video footage, participants could stop video clips, rewind, and play each clip more slowly. They could also answer multiple questions, including questions that required careful consideration of a behavior that may be more difficult to observe or interpret.
As for technical infrastructure, the resources available to a project may dictate whether it is possible to collect data from archived wildlife cam video footage or in real time. We have made the code developed for the live data tagging tool publicly available on BitBucket, but recognize that it will take someone with programming experience to adapt it to another project’s website. If the project team does not have anyone with programming experience and is unable to hire a programmer, then uploading archived video to Zooniverse may be the best option. There is still programming experience needed to work with Zooniverse (cutting archived video footage into clips, exporting and transforming data to be usable), but it is substantially less than adapting a new tool to a website. Our team did not have programming experience when working with Zooniverse, but figured out how to cut archive video footage into clips and worked with a volunteer on Zooniverse to work with the data output from the site.
One last consideration is that participants, especially those with less knowledge of the subject matter at the outset, may feel more comfortable collecting data from archived video footage. When evaluators interviewed participants, they found that some people felt more confident collecting data from archived footage because they were able to watch a clip multiple times and slow down the video. Although live data collection can be exciting to capture events that are happening in real time, participants were not able to rewind or slow down the video. This feature could be added, although if many events occur rapidly, participants may feel they are missing new events while replaying those that just occurred.
References
Anton V, Hartley S, Geldenhuis A, Wittmer HU. 2018. Monitoring the mammalian fauna of urban areas using remote cameras and citizen science. J Urban Ecol. 4(1):1–9. doi:10.1093/jue/juy002.
Kosmala M, Wiggins A, Swanson A, Simmons B. 2016. Assessing data quality in citizen science. Front Ecol Environ. 14(10):551–560. doi:10.1002/fee.1436.
McCarthy MS, Stephens C, Dieguez P, Samuni L, Després-Einspenner ML, Harder B, Landsmann A, Lynn LK, Maldonado N, Ročkaiová Z, et al. 2021. Chimpanzee identification and social network construction through an online citizen science platform. Ecol Evol. 11(4):1598–1608. doi:10.1002/ece3.7128.
Schulwitz SE, Spurling DP, Davis TS, McClure CJW. 2018. Webcams as an untapped opportunity to conduct citizen science: Six years of the American Kestrel Partnership’s KestrelCam. Glob Ecol Conserv. 15:e00434. doi:10.1016/j.gecco.2018.e00434. https://doi.org/10.1016/j.gecco.2018.e00434.
Swanson A, Kosmala M, Lintott C, Packer C. 2016. A generalized approach for producing, quantifying, and validating citizen science data from wildlife images. Conserv Biol. 30(3):520–531. doi:10.1111/cobi.12695.
Swanson A, Kosmala M, Lintott C, Simpson R, Smith A, Packer C. 2015. Snapshot Serengeti, high-frequency annotated camera trap images of 40 mammalian species in an African savanna. Sci Data. 2:1–14. doi:10.1038/sdata.2015.26.