Cornell Feeders Live: Data Exploration Is Around The Corner
April 21, 2021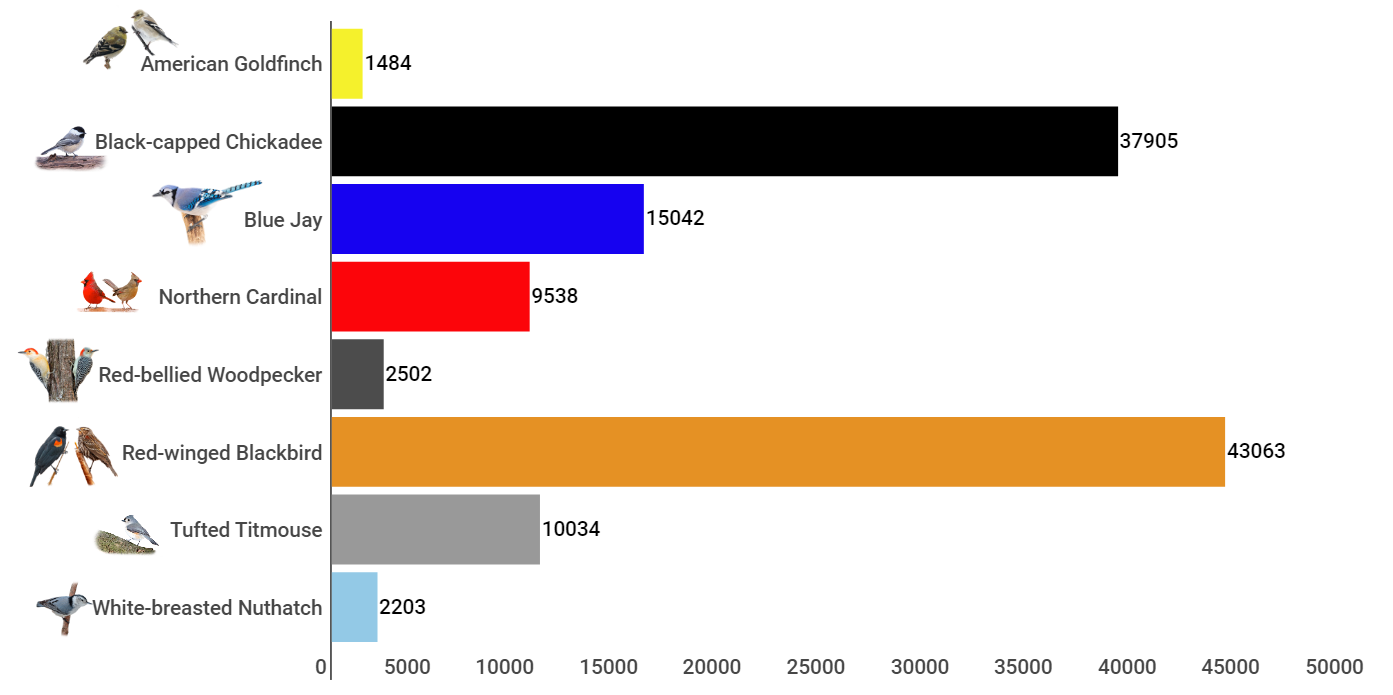
Thank you to the 495 people who participated in the data collection phase, from tagging data to sharing your thoughts and questions on the Discussion Board. We’re excited to start digging into the incredible amount of data you collected: more than 120,000 observations!
We’ll be seeking to answer two questions with this data: (1) What is the daily visitation pattern of different species at the feeders? (2) How does weather affect the probability of different species visiting the feeders? To answer these questions, we’ll use visitation data that was collected during the live data tagging activity and weather data that we retrieved from a weather station at the Ithaca Airport (less than two miles away).
So sit tight while the Bird Cams staff works with the data to create visualizations so that we can all explore together in the next phase of the investigation: data exploration.
If you can’t wait and want to take a peek at the raw data yourself, please feel free to reach out to us at birdcams@cornell.edu. Thanks again for helping us reach this milestone; we can’t wait to continue working with you all in the next phase of the investigation.