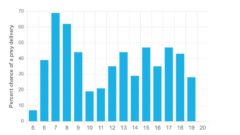
Nestlings snack all day on the prey delivered in the morning or afternoon
Last week we released the first set of visualizations that looked at participants’ sampling effort and the first behavior we studied: vocalizations. This week we dive into the other intriguing and fun-to-watch behaviors: feedings, prey deliveries, and three nestling-specific ones (flapping, walking, and mantling). To kick off this second week of data exploration, we feature two...
October 13, 2020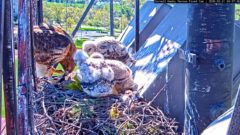
When were (or weren’t) we watching?
In the midst of the pandemic this past summer, the community came together and connected with nature by collecting data on the Cornell Lab’s Red-tailed Hawk cam. From May to June, over 320 people collected data to better understand the frequency of certain hawk behaviors and how the frequency might vary with weather. We were excited...
October 2, 2020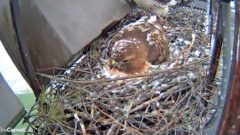
Hawk Happenings: From Observations to Visualizations
Although the Red-tailed Hawks are one of the most common hawks and are found across North America, researchers have only been able to study their behaviors at the nest from afar or infrequently via quick nest checks. The Cornell Lab’s Red-tailed Hawk cam provides a unique opportunity for viewers to watch these birds up close and...
September 20, 2020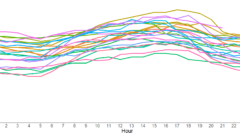
What does the weather data look like?
Weather is important to understand when studying birds because it can potentially affect how they behave. The Hawk Happenings community recognized this and specifically included weather in their research question, theorizing that Red-tailed Hawk behaviors at the nest might vary with changes in the weather. After data collection ended in June, we reached out to the...
September 18, 2020