The Cornell Lab of Ornithology
  • Contact Us
  • Search
  • Donate
Bird Cams Lab
  • Home
  • About Toggle navigation
    • About the Project
    • Project Updates
    • The Team
  • Learn Toggle navigation
    • Resources
    • Code and Data
  • Investigation Archive Toggle navigation
    • Cornell Feeders Live
    • Battling Birds: Panama Edition
    • Hawk Happenings
    • Panama Live
    • Hawk Talk
    • Battling Birds
  • Contact Us
  • Search
  • Donate

Search

  • Date - Newest First
  • Date - Oldest First
  • Title A-Z
  • Title Z-A
  • A bar graph with blue and orange bars. The number of observations is on the vertical axis from 0 to 30. The time is on the horizontal axis from 8:00 to 16:00.

    Cornell Feeders Live: From Observations to Visualizations

    The Cornell Lab of Ornithology’s FeederWatch cam gives us a window into the lives of birds seen at backyard feeders in the Northeast United States. While many of the species are considered common and well-researched, we can still make discoveries in the context of their behavior at a bird feeder.  Back in February, the Bird Cams...

    May 26, 2021
  • A graph with different colored lines for each day during data collection (3/31 through 4/14). Hour is on the horizontal axis and Temperature(Fahrenheit is on the vertical axis. The horizontal axis is from 5 to 19 and the vertical axis is from 0 to 80. The lines vary in their shape, but most follow a pattern of lower in the morning and greater in the afternoon.

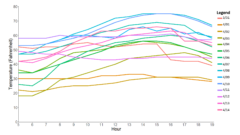
    What was the weather like during data collection for Cornell Feeders Live?

    When we came together to figure out what to study with the Cornell FeederWatch cam, many people in the community were interested in the effects of weather. Several people shared their observations at their own bird feeders and their predictions for how weather would affect birds’ behavior at the feeder. “I would really like to see...

    May 27, 2021
  • A bar graph with light blue bars. The horizontal axis starts with "Project Starts" with no bar and then light blue bars for each day 03/31 to 04/14 with the height being the number of hours watched by at least one person for each day. The maximum number of hours is 16 and the values range from about 11 to just more than 14 hours.

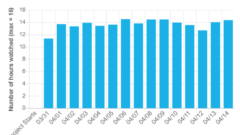
    We were almost always watching!

    For two weeks, the Bird Cams Lab and Bird Cams community came together to tag data in real time from the Cornell FeederWatch cam. At the end of data collection, the community amassed over 120,000 observations of the eight study species visiting the feeding station: American Goldfinch, Black-capped Chickadee, Blue Jay, Red-bellied Woodpecker, Red-winged Blackbird,...

    June 1, 2021
  • A line graph with three different colored lines each referring to a study species. Hour is on the horizontal axis from 5 to 19 and percentage chance species is present is on the vertical axis from 0 to 100. For all species except Northern Cardinal, the percentage chance increases as the morning advances and then decreases in the afternoon. The exact shape of this curved shape varies by species, but is the general pattern. The other species are grayed out and only the American Goldfinch, Black-capped chickadee, and Blue Jay are shown.

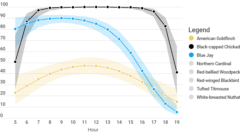
    Birds Don’t Check The Temperature Before Visiting The Feeder

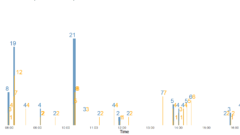
    For the Cornell Feeders Live investigation, we have shared visualizations that highlight (1) the sampling effort (i.e., amount of time watched) and (2) when the study species visited the feeding station. This second set of visualizations helped us start to answer our first research question: What is the daily visitation pattern of different species at...

    June 22, 2021
Cornell Logo

This material is based upon work supported by the National Science Foundation under Grant 1713225. Any opinions, findings, and conclusions or recommendations expressed in this material are those of the author(s) and do not necessarily reflect the views of the National Science Foundation.

As part of this NSF-funded study, online contributions for this project, including data and comments (without identifying individuals), may be used to inform our understanding of the project and its outcomes.

  • Contact Us
  • Web Accessibility Assistance
  • Privacy Policy
  • Terms of use
Copyright © 2022 Cornell University