Latest Posts
Birds Don’t Check The Temperature Before Visiting The Feeder
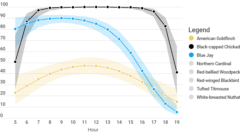
For the Cornell Feeders Live investigation, we have shared visualizations that highlight (1) the sampling effort (i.e., amount of time watched) and (2) when the study species visited the feeding station. This second set of visualizations helped us start to answer our first research question: What is the daily visitation pattern of different species at...
June 22, 2021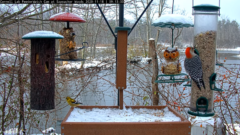
Birds, Feeders, and Science Oh My! What Can We Discover Together?
Tune in to learn more about the birds on the Cornell Lab of Ornithology's FeederWatch cam and Cornell Feeders Live, Bird Cams Lab's newest scientific investigation that is already underway! Right now, the Bird Cams Lab community is in the midst of deciding what question to investigate with the Cornell FeederWatch cam in an online...
February 22, 2021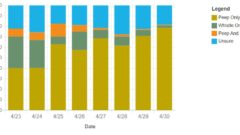
Changing Vocalizations
Last week we found out that when nestling were vocalizing, they were also primarily being fed or the adult was brooding. This week, we’ll dig deeper into both nestling and adult vocalizations to see if and how they change over time. Click here to see the interactive version of this graph. In the chart above we focus...
January 22, 2020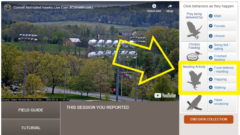
Collect New Data On Nestlings
Have you watched the Cornell Hawks cam recently? The nestlings are growing up so fast! Last week we launched data collection for the newly named Hawk Happenings investigation. 52 people have collected 305 observations! Today, we’ve switch the data collection buttons about brooding for ones about nestling activity. The nestlings are now old enough to maintain their body...
May 27, 2020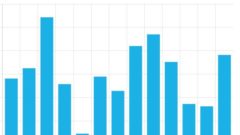
Community inspires deeper dive into the data
The Panama Live community inspired us to dig deeper into the data and create a new set of visualizations! During last week’s live webinar, Panama Live: Uncovering The Lives Of Six Tropical Feeder Birds (watch it here if you missed the live event), attendees wanted to learn more about how we collected data, including what...
September 22, 2020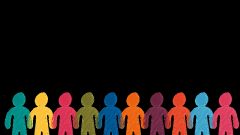
Community Inspires More Visualizations
Thank you to everyone who has joined us in this phase of data exploration! Your ideas and questions have inspired us to dig deeper into the data by creating a new set of visuals. Before we dive into the interactive visuals, we want to feature an interesting visual that looks at the interaction between the number...
October 3, 2019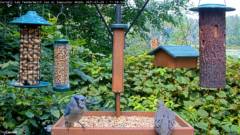
Cornell Feeders Live Final Report
Summary Hundreds of people came together to work with researchers to design an investigation that looked at the birds visiting the Cornell FeederWatch cam. After weeks of sharing observations, discussing, and taking a vote, the community decided to investigate visitation patterns of eight species and the ways in which these patterns could be affected by...
July 30, 2021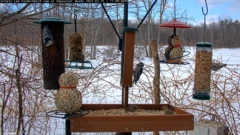
Cornell Feeders Live Question Design
This section is currently inactive. We've finished brainstorming. See the most recent project updates. Which Question to Investigate? The observations and the discussion on the Wonder Board generated a variety of questions, and we've summarized the questions with the most upvotes into five groups to focus the conversation on honing the most interesting and answerable questions before we...
March 1, 2021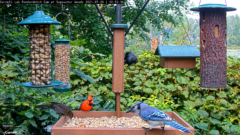
Cornell Feeders Live Report Wraps Up Bird Cams Lab
Thanks to the thoughtful feedback of 15 reviewers, we are now in the last phase of the Cornell Feeders Live investigation: sharing findings. We invite you to read the report and share it with your family and friends. In the report, we document all the work we accomplished together as a community, and what the...
July 30, 2021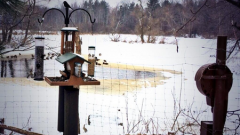
Cornell Feeders Live: About The Feeder
Cornell Feeders Live is a project co-created by cam viewers and scientists to answer two questions: (1) What is the daily visitation pattern of different species at the feeders? (2) How does weather affect the probability of different species visiting the feeders? Cam viewers collected data in real time from the Cornell FeederWatch cam, clicking a...
May 24, 2021